4. Programmable Filter
ParaView のパイプラインモジュールは、次のいずれかの処理を行います。データを生成するか、入力データを処理します。データを生成するために、モジュールは Sources > Sphere のような数学モデルを使用するか、ディスクからファイルを読み込むことができます。データを処理するには、定義された操作を適用して新しい出力を生成することによって、入力データを変換する必要があります。 ParaView には、多数のユーザーのニーズを満たすリーダー、データソース、およびデータフィルタが多数用意されています。使用可能なコレクションが要求を満たしていない場合、 ParaView はプラグインを介して新しいモジュールを追加するメカニズムを提供します。しかし、従来のプラグインはハードコアな開発者を対象としています。 ParaView およびVTKが提供するデータ処理APIを使用して、C++で記述されています。 ParaView のすべての分散バージョンで動作するC++プラグインの構築とパッケージ化の複雑さは、非常に困難であり、上級 ParaView ユーザーにとっても大きな障壁となります。Pythonベースのプログラマブルフィルタとソースは、これに代わる簡単な方法を提供します。新しいモジュールは、従来のC++モジュールと同様に、データを生成および処理するために ParaView によって実行されるPythonスクリプトとして記述できます。これらのスクリプトは標準のPythonスクリプトであるため、NumPyなどのPythonパッケージにアクセスして、データ変換に役立つ数値演算を行うことができます。
この章では、Pythonを使ってParaViewに新しいデータ処理モジュールを追加する方法を、例を使って説明します。データ処理APIの詳細については、 5 章 を参照してください。
Common Errors
このガイドでは、これまで pvpython のPythonスクリプトの例を見てきました。これらのスクリプトは、 paraview UIを使用して実行するアクションをスクリプト化するために使用されます。 Programmable Source と Programmable Filter で記述するスクリプトはまったく異なります。データ処理APIは、データ処理パイプライン内で実行されるため、処理中のデータにアクセスすることができます。クライアントサーバーモードでは、このようなスクリプトは実際にサーバー側で実行され、複数のMPIランクにわたって並列に実行される可能性があります。したがって、たとえば Programmable Source スクリプトに paraview.simple Pythonモジュールをインポートしようとしても、サポートされていないので予期しない結果になります。
4.1. プログラマブルモジュールを理解する
プログラマブルモジュールでは、フィルタとソースのカスタムコードを記述します。 データモデルだけでなくパイプライン実行のさまざまな段階を含め、VTK (および ParaView )データ処理パイプラインの基本を理解していることが求められます。VTKデータモデルの概要については、 3.1 章 を参照してください。VTKパイプライン実行モデルの詳細な説明は本書の範囲を超えていますが、この章の残りの部分で説明されている例に加えて、本節で説明されている基本事項は、実用的なモジュールの作成に役立つはずです。VTKパイプライン実行ステージの詳細については、[BerkGeveci] を参照してください。
paraview でプログラマブルソースまたはフィルタを作成するには、それぞれ Sources > Programmable Source、 Filters > Programmable Filter または Sources > Programmable Annotation メニューを使用します。 Programmable Filter と Programmable Annotation は他のフィルタと同様にフィルタであるため、カレントアクティブソースに接続されます。つまり、カレントアクティブソースがこの新しいフィルタへの入力になります。一方、 Programmable Source には入力がありません。
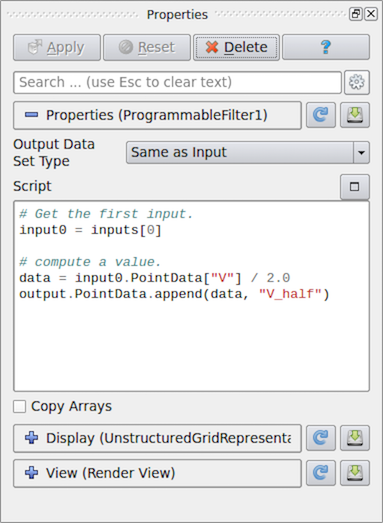
図 4.19 paraview 内の Programmable Filter に対する Properties パネル
これらのプログラマブルモジュールを作成した後、最初に指定するものの1つが Output Data Set Type です。このオプションでは、このモジュールが生成するデータセットのタイプを選択できます。提供されるオプションには、 3.1 章 で説明されているいくつかのデータ型が含まれます。また、 Programmable Filter では、フィルタが入力データセットタイプを保持することを示すために、 Same as Input を選択できます。
次は主要部分である Script です。ここにPythonスクリプトを入力し、モジュールが生成するデータセットを入力から生成または処理します。他のPythonスクリプトと同様に、このスクリプトに他のPythonパッケージやモジュールをインポートすることができます。クライアントサーバーモードで実行している場合は、このスクリプトはサーバー・サイドで実行されることに注意してください。したがって、インポートするモジュールまたはパッケージは、エラーを回避するためにサーバー側で使用可能である必要があります。
スクリプトは、パイプライン実行の RequestData パスと呼ばれるパスで実行されます。これは、アルゴリズムが出力データセットを生成することが期待されるパイプラインパスです。
パイプラインの実行には、ほかにもいくつかのパスがあります。これらのプログラマブルモジュールで実行するPythonスクリプトを指定できるものは、次のとおりです。
RequestInformation: このパスでは、アルゴリズムは、生成されるデータに関して利用可能なメタデータをパイプラインに提供することが期待されています。これには、データセット内のタイムステップ数や、時間データセットの時間値、構造化データセットの範囲などが含まれます。これは RequestData パスの前に呼び出されます。RequestData パスでは、パイプラインがこのパスで提供されるメタデータに基づいて要求を修飾する可能性があります。たとえば、時間データセットに複数のタイムステップがあることをアルゴリズムが通知した場合、パイプラインは、アルゴリズムが
RequestDataにあるこれらのタイムステップのうちの1つのタイムステップのデータを生成するよう要求できます。RequestUpdateExtent: このパスでは、フィルタは、上流パイプラインに渡される実行要求を修飾する機会を得ます。たとえば、上流のリーダーが RequestUpdateExtent で複数のタイムステップを生成できることを RequestInformation スクリプトでアナウンスした場合、このフィルタが上流のリーダーに特定のタイムステップを要求できます。このパスは、RequestInformation の後、
RequestDataの前に呼び出されます。このパスのスクリプトを提供することはあまり一般的ではありません。
スクリプトは、 RequestInformation Script の RequestInformation パスと RequestUpdateExtent Script の RequestUpdateExtent パスに指定できます。RequestUpdateExtent パスは、入力値を持たないアルゴリズムにはあまり意味がないため、 RequestUpdateExtent Script は Programmable Source では使用できません。Programmable Annotation には RequestData スクリプトしかありません。これは、このコンテキストで意味のある唯一のスクリプトだからです。
4.2. プログラマブルソースのレシピ
本節では、 Programmable Source のいくつかのレシピについて説明します。 Programmable Source の一般的な使用方法は、リーダーのプロトタイプ作成です。読者ライブラリがすでにPython APIを提供している場合は、適切なPythonパッケージを簡単にインポートし、 Programmable Source を使用してデータセットを読み取ることができます。
Did you know?
この章のほとんどの例では、データ配列へのアクセスと作成にNumPy中心のAPIを使用します。また、配列の作成とアクセスには、VTKのPythonラップAPIを使用できます。しかし、NumPyの存在を考えると、VTKのAPIを直接使う必要はほとんどありません。
4.2.1. CSVファイルの読み込み
この例では、CSVファイルを読み込み、 Programmable Source を使用してテーブル ( 3.1.9 章 )を生成します。NumPyを使用してCSVファイルを解析し、読み込まれた配列をパイプラインに直接渡します。 Output DataSet Type は vtkTable に設定する必要があります。
# Code for 'Script'

# We will use NumPy to read the csv file.
# Refer to NumPy documentation for genfromtxt() for details on
# customizing the CSV file parsing.

import numpy as np
# assuming data.csv is a CSV file with the 1st row being the names names for
# the columns
data = np.genfromtxt("data.csv", dtype=None, names=True, delimiter=',', autostrip=True)
for name in data.dtype.names:
   array = data[name]

   # You can directly pass a NumPy array to the pipeline.
   # Since ParaView expects all arrays to be named, you
   # need to assign it a name in the 'append' call.
   output.RowData.append(array, name)
4.2.2. CSVファイルシリーズの読み込み
4.2.1 章 の例を基に、一連のファイルを時系列として読み込むとします。4.1 章 で説明したように、生成されるデータに関するメタデータ (タイムステップ情報を含む) は RequestInformation パスでアナウンスされます。したがって、この例では、 RequestInformation Script も指定する必要があります。
前述のとおり、 Output DataSet Type は vtkTable に設定する必要があります。 ここで、時間ステップをアナウンスするために、以下を RequestInformation Script として使用します。
# Code for 'RequestInformation Script'.
def setOutputTimesteps(algorithm, timesteps):
    "helper routine to set timestep information"
    executive = algorithm.GetExecutive()
    outInfo = executive.GetOutputInformation(0)

    outInfo.Remove(executive.TIME_STEPS())
    for timestep in timesteps:
        outInfo.Append(executive.TIME_STEPS(), timestep)

    outInfo.Remove(executive.TIME_RANGE())
    outInfo.Append(executive.TIME_RANGE(), timesteps[0])
    outInfo.Append(executive.TIME_RANGE(), timesteps[-1])

# As an example, let's say we have 4 files in the file series that we
# want to say are producing time 0, 10, 20, and 30.
setOutputTimesteps(self, (0, 10, 20, 30))
Script は前節のものと似ていますが、要求されたタイムステップに基づいて特定のCSVファイルを読み取る点が異なります。
# Code for 'Script'
def GetUpdateTimestep(algorithm):
    """Returns the requested time value, or None if not present"""
    executive = algorithm.GetExecutive()
    outInfo = executive.GetOutputInformation(0)
    return outInfo.Get(executive.UPDATE_TIME_STEP()) \
              if outInfo.Has(executive.UPDATE_TIME_STEP()) else None

# This is the requested time-step. This may not be exactly equal to the
# timesteps published in RequestInformation(). Your code must handle that
# correctly.
req_time = GetUpdateTimestep(self)

# Now, use req_time to determine which CSV file to read and read it as before.
# Remember req_time need not match the time values put out in
# 'RequestInformation Script'. Your code need to pick an appropriate file to
# read, irrespective.

...
# TODO: Generate the data as you want.

# Now mark the timestep produced.
output.GetInformation().Set(output.DATA_TIME_STEP(), req_time)
4.2.3. パーティクルを含むCSVファイルの読み込み
これは、4.2.1 章 に似ています。ここで、CSVに X、Y そして Z という3つの列があるとします。これらの列を点座標として扱い、 vtkTable ではなく、点を持つ vtkPolyData を生成します。そのためには、まず Output DataSet Type が vtkPolyData に設定されていることを確認します。次に、次の Script を使用します。
# Code for 'Script'

from vtk.numpy_interface import algorithms as algs
from vtk.numpy_interface import dataset_adapter as dsa
import numpy as np

# assuming data.csv is a CSV file with the 1st row being the names names for
# the columns
data = np.genfromtxt("/tmp/points.csv", dtype=None, names=True, delimiter=',', autostrip=True)

# convert the 3 arrays into a single 3 component array for
# use as the coordinates for the points.
coordinates = algs.make_vector(data["X"], data["Y"], data["Z"])

# create a vtkPoints container to store all the
# point coordinates.
pts = vtk.vtkPoints()

# numpyTovtkDataArray is needed to called directly to convert the NumPy
# to a vtkDataArray which vtkPoints::SetData() expects.
pts.SetData(dsa.numpyTovtkDataArray(coordinates, "Points"))

# set the pts on the output.
output.SetPoints(pts)

# next, we define the cells i.e. the connectivity for this mesh.
# here, we are creating merely a point could, so we'll add
# that as a single poly vextex cell.
numPts = pts.GetNumberOfPoints()
# ptIds is the list of point ids in this cell
# (which is all the points)
ptIds = vtk.vtkIdList()
ptIds.SetNumberOfIds(numPts)
for a in xrange(numPts):
    ptIds.SetId(a, a)

# Allocate space for 1 cell.
output.Allocate(1)
output.InsertNextCell(vtk.VTK_POLY_VERTEX, ptIds)

# We can also pass all the array read from the CSV
# as point data arrays.
for name in data.dtype.names:
    array = data[name]
    output.PointData.append(array, name)
ここで注意すべき点は、出力データセットのジオメトリとトポロジを定義する必要があることです。データ型ごとに、これらの指定方法に関する要件が異なります。たとえば、vtkUnstructuredGridやvtkPolyDataなどの非構造化データセットの場合、ジオメトリとすべての接続情報を明示的に指定する必要があります。vtkImageDataでは、ジオメトリは原点、間隔、範囲を使用して定義され、接続は暗黙的に行われます。
4.2.4. バイナリ2Dイメージの読み込み
このレシピでは、3Dボリュームを表す生のバイナリデータを読み取る方法を示します。rawバイナリファイルはボリュームのエクステントとデータ型に関する情報をエンコードしないため、エクステントとデータ型は既知で固定されているものとします。
イメージボリュームを作成するには、構造化エクステントに関する情報を RequestInformation で指定する必要があります。 Output Data Set Type が vtkImageData に設定されていることを確認します。
# Code for 'RequestInformation Script'.
executive = self.GetExecutive()
outInfo = executive.GetOutputInformation(0)
# we assume the dimensions are (48, 62, 42).
outInfo.Set(executive.WHOLE_EXTENT(), 0, 47, 0, 61, 0, 41)
outInfo.Set(vtk.vtkDataObject.SPACING(), 1, 1, 1)
データを読み取るための Script は、次のように記述できます。
# Code for 'Script'
import numpy as np

# read raw binary data.
# ensure 'dtype' is set properly.
data = np.fromfile("HeadMRVolume.raw", dtype=np.uint8)

dims = [48, 62, 42]
assert data.shape[0] == dims[0]*dims[1]*dims[2], "dimension mismatch"

output.SetExtent(0, dims[0]-1, 0, dims[1]-1, 0, dims[2]-1)
output.PointData.append(data, "scalars")
output.PointData.SetActiveScalars("scalars")
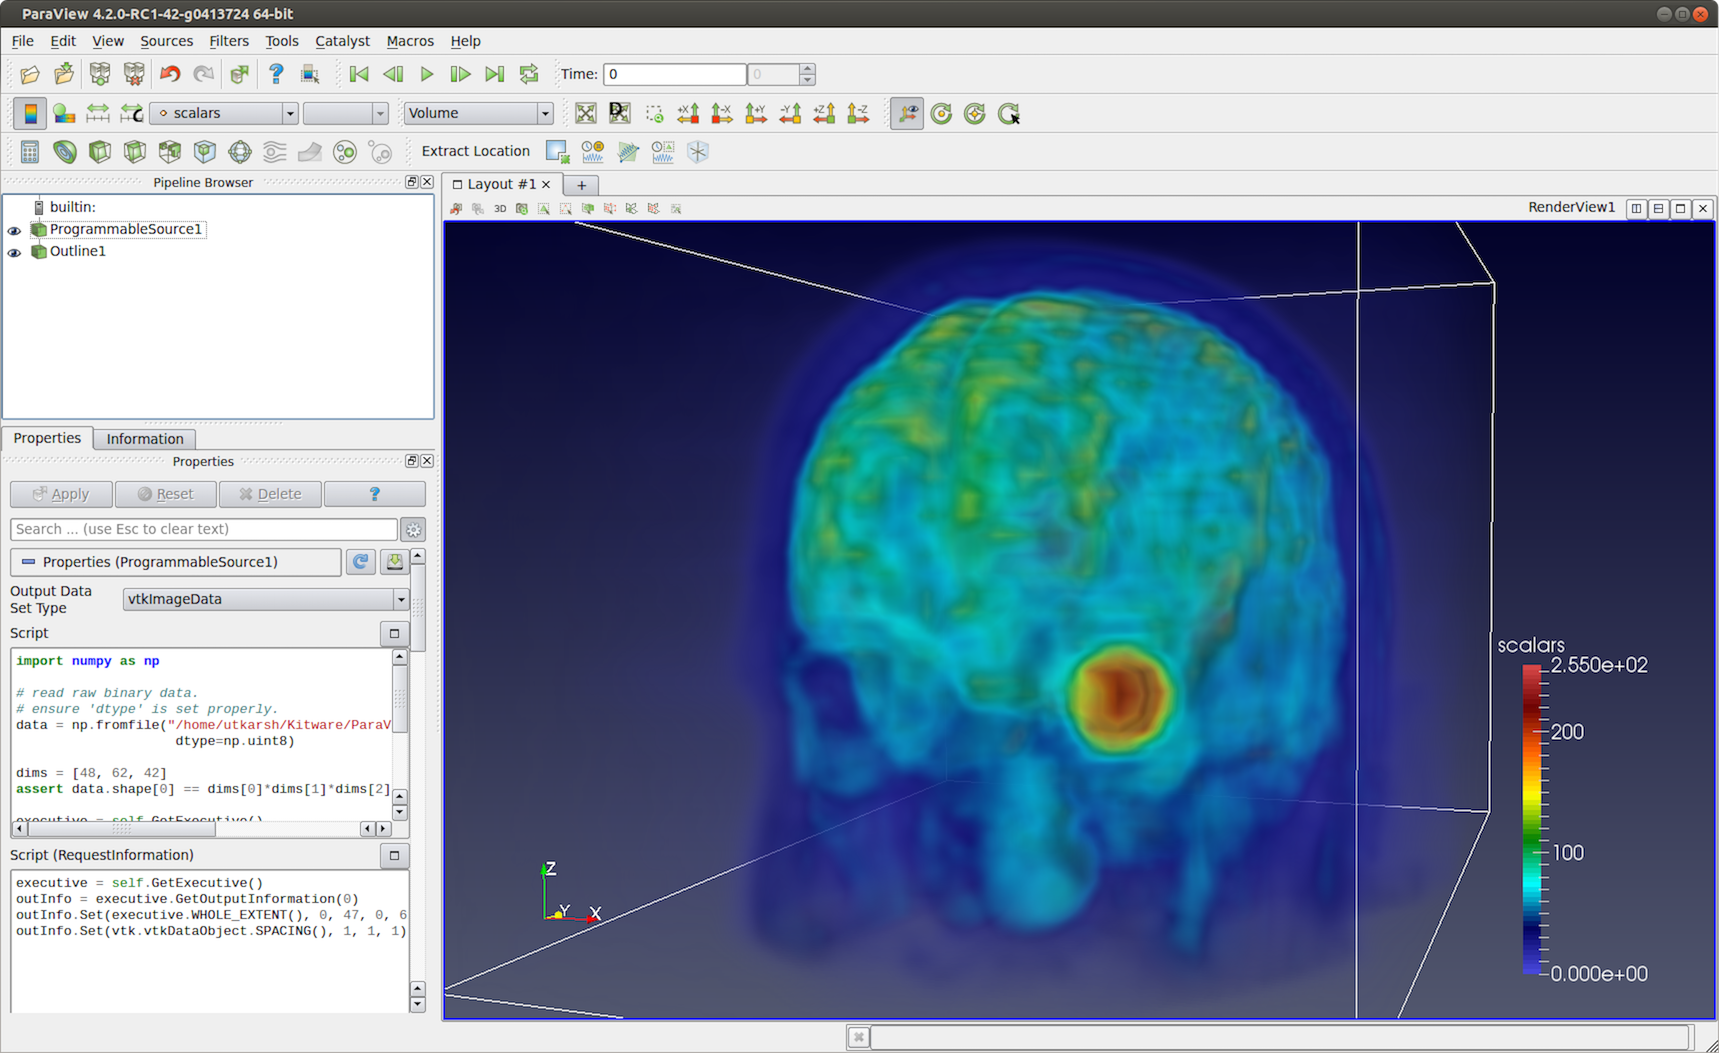
図 4.20 VTKデータリポジトリの HeadMRVolume.raw ファイルを読み込むために使用される Programmable Source
4.2.5. ヘリックスソース
別のポリデータソースの例を次に示します。今回はプログラムでデータを生成します。
# Code for 'Script'

#This script generates a helix curve.
#This is intended as the script of a 'Programmable Source'
import math
import numpy as np
from vtk.numpy_interface import algorithms as algs
from vtk.numpy_interface import dataset_adapter as dsa

numPts = 80  # Points along Helix
length = 8.0 # Length of Helix
rounds = 3.0 # Number of times around

# Compute the point coordinates for the helix.
index = np.arange(0, numPts, dtype=np.int32)
scalars = index * rounds * 2 * math.pi / numPts
x = index * length / numPts;
y = np.sin(scalars)
z = np.cos(scalars)

# Create a (x,y,z) coordinates array and associate that with
# points to pass to the output dataset.
coordinates = algs.make_vector(x, y, z)
pts = vtk.vtkPoints()
pts.SetData(dsa.numpyTovtkDataArray(coordinates, 'Points'))
output.SetPoints(pts)

# Add scalars to the output point data.
output.PointData.append(index, 'Index')
output.PointData.append(scalars, 'Scalars')

# Next, we need to define the topology i.e.
# cell information. This helix will be a single
# polyline connecting all the  points in order.
ptIds = vtk.vtkIdList()
ptIds.SetNumberOfIds(numPts)
for i in xrange(numPts):
   #Add the points to the line. The first value indicates
   #the order of the point on the line. The second value
   #is a reference to a point in a vtkPoints object. Depends
   #on the order that Points were added to vtkPoints object.
   #Note that this will not be associated with actual points
   #until it is added to a vtkPolyData object which holds a
   #vtkPoints object.
   ptIds.SetId(i, i)

# Allocate the number of 'cells' that will be added. We are just
# adding one vtkPolyLine 'cell' to the vtkPolyData object.
output.Allocate(1, 1)

# Add the poly line 'cell' to the vtkPolyData object.
output.InsertNextCell(vtk.VTK_POLY_LINE, ptIds)
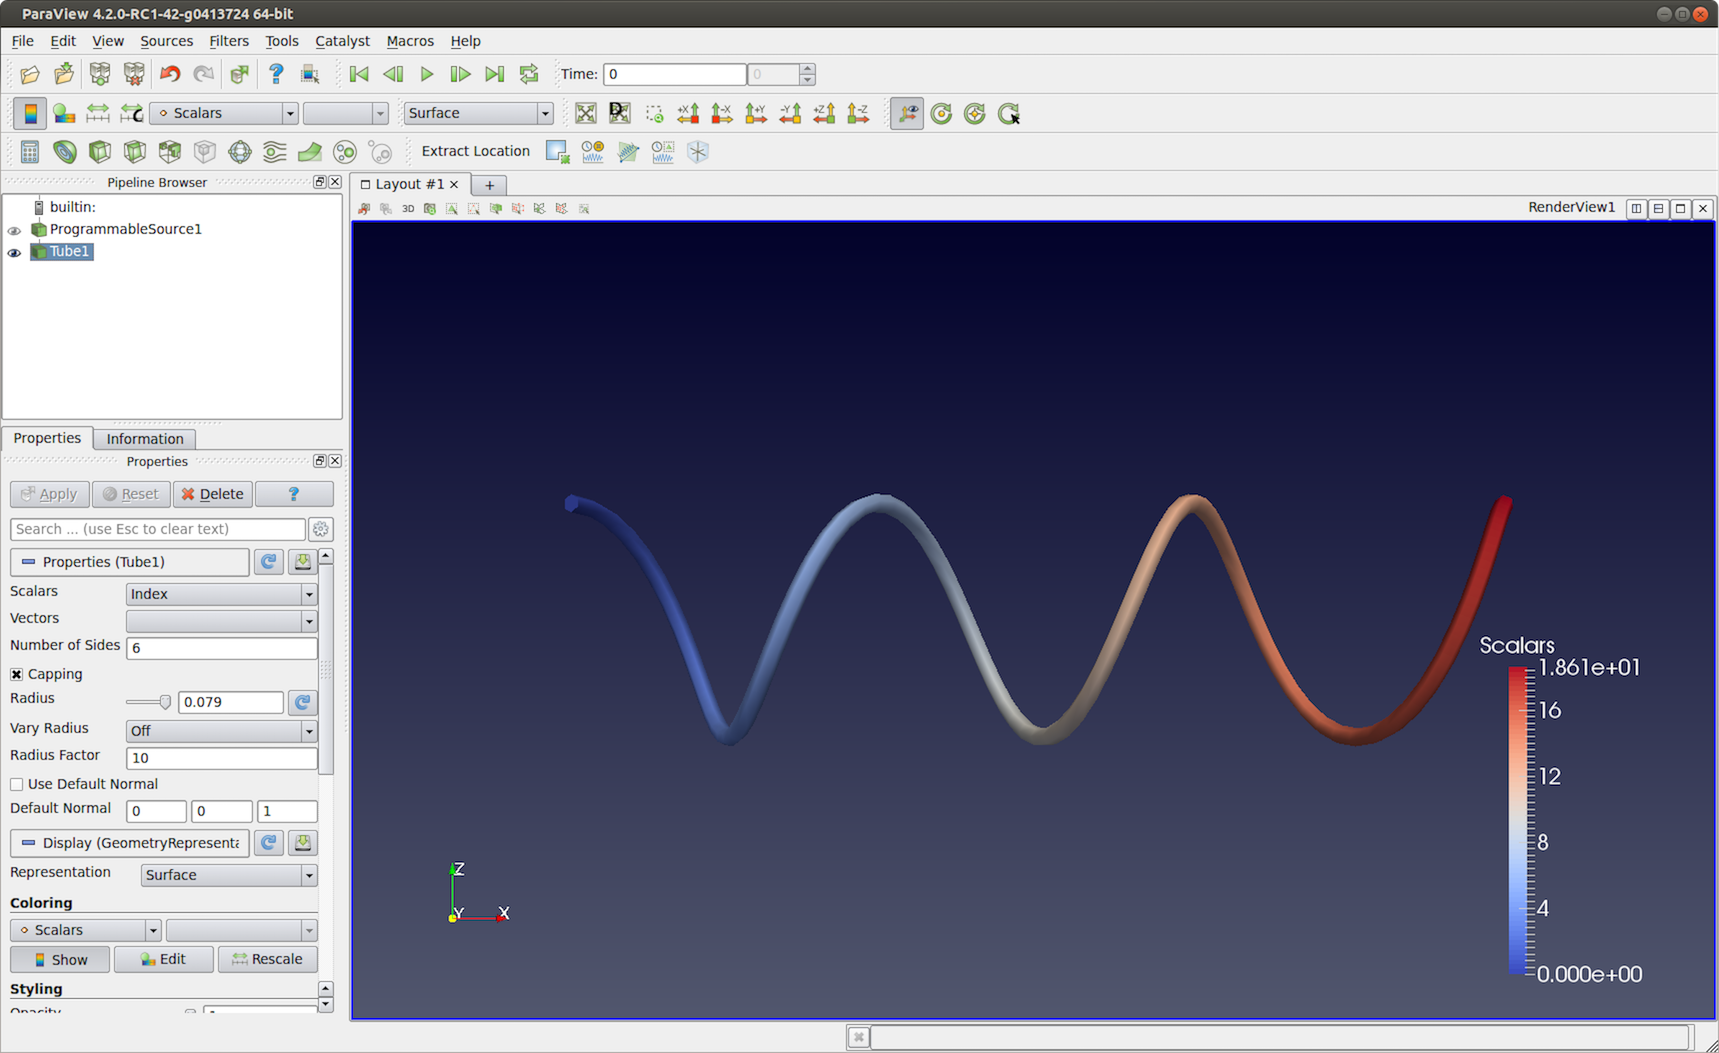
図 4.21 4.2.5 章 のスクリプトを使用して生成された Programmable Source 出力。この可視化では、 Tube フィルタを使用して出力ポリラインをより目立つようにします。
4.3. Programmable Filterのレシピ
Programmable Source と Programmable Filter の違いの1つは、後者が少なくとも1つの入力を要求することです。もちろん、 Programmable Filter のコードは入力をまったく無視して、 Programmable Source とまったく同じように動作します。 Programmable Filter は、データ変換をカスタマイズするためのものです。たとえば、 Python Calculator や Calculator で直接実行できない式を使用して派生量を計算する場合や、入力を処理するために ParaView に公開されていない他のPythonパッケージやVTKフィルタを使用する場合に便利です。
本節では、 Programmable Filter のさまざまなレシピについて説明します。
4.3.1. 入力配列に基づいて新しい点/セルデータ配列を追加する
Python Calculator は、派生変数を計算する簡単なメカニズムを提供します。 Programmable Filter を使用することもできます。 通常、このような場合は、 Output DataSet Type が Same as Input に設定されていることを確認してください。
# Code for 'Script'

# 'inputs' is set to an array with data objects produced by inputs to
# this filter.

# Get the first input.
input0 = inputs[0]

# compute a value.
dataArray = input0.PointData["V"] / 2.0

# To access cell data, you can use input0.CellData.

# 'output' is a variable set to the output dataset.
output.PointData.append(dataArray, "V_half")
このコードで注意しなければならないのは、入力データセットがMultiblockデータセット( 3.1.10 章 )のような複合データセットであっても、期待通りに動作するということです。この動作の詳細については、5 章 を参照してください。ただし、入力マルチブロックデータセット内のブロックを明示的に繰り返し処理する場合があります。そのために、次のスニペットを使用できます。
input0 = inputs[0]
if input0.IsA("vtkCompositeDataSet"):
    # iterate over all non-empty blocks in the input
    # composite dataset, including multiblock and AMR datasets.
    for block in input0:
        processBlock(block)
else:
    processBlock(input0)
4.3.2. 四面体体積の計算
このレシピでは、入力データセット内の各四面体セルの体積を計算します。いつでも簡単に Python Calculator を使って、式 volume(inputs[0]) を使ってセルの体積を計算できます。このレシピは、APIを説明するために提供されています。
出力タイプが Same as Input に設定されていることを確認してください。このフィルタは、入力が非構造格子であると想定します( 3.1.7 章)。
# Code for 'Script'.

import numpy as np

# This filter computes the volume of the tetrahedra in an unstructured mesh.
# Note, this is just an illustration and not  the most efficient way for
# computing cell volume. You should use 'Python Calculator' instead.
input0 = inputs[0]

numTets = input0.GetNumberOfCells()

volumeArray = np.empty(numTets, dtype=np.float64)
for i in xrange(numTets):
       cell = input0.GetCell(i)
       p1 = input0.GetPoint(cell.GetPointId(0))
       p2 = input0.GetPoint(cell.GetPointId(1))
       p3 = input0.GetPoint(cell.GetPointId(2))
       p4 = input0.GetPoint(cell.GetPointId(3))
       volumeArray[i] = vtk.vtkTetra.ComputeVolume(p1,p2,p3,p4)

output.CellData.append(volumeArray, "Volume")
4.3.3. 2つのデータセット間の共通する点のラベル付け
この例では、 Programmable Filter はAとBの2つの入力データセットを受け取ります。このコマンドは、データセットBを、Aにも含まれるBの点をラベル付けする新しいスカラー配列で出力します。パイプラインブラウザで2つのデータセットを選択し、プログラマブルフィルタを適用する必要があります。
# Code for 'Script'

# Get the two inputs
A = inputs[0]
B = inputs[1]
# use len(inputs) to determine now many inputs are connected
# to this filter.

# We use numpy.in1d to test all which point coordinate components
# in  B are present in A as well.
maskX = np.in1d(B.Points[:,0], A.Points[:,0])
maskY = np.in1d(B.Points[:,1], A.Points[:,1])
maskZ = np.in1d(B.Points[:,2], A.Points[:,2])

# Combining each component mask, we get the mask for point
# itself.
mask = maskX & maskY & maskZ

# Now convert it to uint8, since bool arrays
# cannot be passed back to the VTK pipeline.
mask = np.asarray(mask, dtype=np.uint8)

# Initialize the output and add the labels array

# This ShallowCopy is needed since by default the output is
# initialized to be a shallow copy of the first input (inputs[0]),
# but we want it to be a description of the second input.
output.ShallowCopy(B.VTKObject)
output.PointData.append(mask, "labels")
上記のスクリプトでは、2つの入力が inputs 配列で定義されています。この配列の要素の順序は、 Pipeline Browser でデータソースが選択された順序によって決まります。したがって、inputs[0] は最初に選択されたデータソースであり、inputs[1] は2番目に選択されたデータソースです。
4.4. Programmable Annotationのレシピ
プログラマブルアノテーションと他のプログラマブルモジュールとの主な違いは、出力がテキスト表現として示されることである。出力は、単一のタプルを含む単一の1コンポーネントの文字列配列を含む vtkTable であると想定されています。このタプルは、Text ソースや Python Annotation フィルタの出力に似たテキスト表現として表示されます。
デフォルトでは、 Programmable Annotation スクリプトにはこのテーブルを作成するために必要なものがすべて含まれています。
Programmable Filter と同様に、Programmable Annotation もデータ表示をカスタマイズするように設計されています。たとえば、Python Annotation や他のアノテーションフィルタでは直接使用できない式を使用して派生量を計算する場合や、他のPythonパッケージや ParaView で公開されていないVTKフィルタを入力の処理に使用する場合などに便利です。
本節では Programmable Annotation のさまざまなレシピを見ていきます。
4.4.1. 0以外のボリュームを持つセルの数の表示
Python Annotation は、データセットや配列上の多くの値を計算するための簡単なメカニズムを提供しますが、ここで提案されているような条件付き操作では、Programmable Annotation を使用する必要があります。
# Code for 'Script'

# 'inputs' is set to an array with data objects produced by inputs to
# this filter.

# Get the first input.
input0 = inputs[0]

# compute the volume of each cell of the input
vols = volume(input0)

# the codepath for composite dataset and non composite dataset can't be shared
# with this operation
if input0.IsA("vtkCompositeDataSet"):

  # create a running sum to iterate over blocks
  num = 0;

  # iterate over blocks
  for i in range(size(vols.Arrays)):
    # count the number of cells with a non-zero volume in this block
    # and add it to the running sum
    num += sum(val > 0 for val in vols.Arrays[i])
else:
  # non-composite case : just  count the number of cells with a non-zero volume
  num = sum(val > 0 for val in vols)

# standard code to display the result
to = self.GetTableOutput()
arr = vtk.vtkStringArray()
arr.SetName("Text")
arr.SetNumberOfComponents(1)
arr.InsertNextValue(str(num))
to.AddColumn(arr)
4.4.2. システムと日付情報を表示する
Python Annotation はPythonモジュールをインポートするメカニズムを提供していませんが、Programmable Annotation でそれを行うのは簡単です。
# Code for 'Script'

# import needed python modules
from datetime import date
import platform

# construct the string to display
string = "Date: %s\n" % date.today()
string += "System: %s" % platform.platform()

# standard code to display the string
to = self.GetTableOutput()
arr = vtk.vtkStringArray()
arr.SetName("Text")
arr.SetNumberOfComponents(1)
arr.InsertNextValue(string)
to.AddColumn(arr)
4.5. Python アルゴリズム
Pythonベースのデータ処理モジュールのプロトタイプを作成するには、Programmable Source と Programmable Filter が便利です。このようなモジュールを配布したり、ユーザインタフェースを使用してモジュールにパッケージ化する場合は、代わりに VTKPythonAlgorithmBase ベースの方法をお勧めします。 ここでPythonクラスを書くには、VTKPythonAlgorithmBase をサブクラス化し、他のVTKベースのフィルタまたはソースと同様に、データ処理を行うメソッドを実装します。 decorators (デコレータ)と呼ばれるPythonの構文アドオンを使ってクラスに注釈を付けると、そのクラスをParaViewにフィルタやソースとして簡単に公開でき、ParaViewは自動的にUIウィジェットをコントロールパラメータなどに追加します。
まず、図 4.19 にある単純なスクリプトから始めましょう。以下は、同じ操作のための VTKPythonAlgorithmBase サブクラスを作成するPythonスクリプトです。
from vtkmodules.vtkCommonDataModel import vtkDataSet
from vtkmodules.util.vtkAlgorithm import VTKPythonAlgorithmBase
from vtkmodules.numpy_interface import dataset_adapter as dsa

class HalfVFilter(VTKPythonAlgorithmBase):
    def __init__(self):
        VTKPythonAlgorithmBase.__init__(self)

    def RequestData(self, request, inInfo, outInfo):
        # get the first input.
        input0 = dsa.WrapDataObject(vtkDataSet.GetData(inInfo[0]))

        # compute a value.
        data = input0.PointData["V"] / 2.0

        # add to output
        output = dsa.WrapDataObject(vtkDataSet.GetData(outInfo))
        output.PointData.append(data, "V_half");
        return 1
ParaViewでこのフィルタを公開するには、次のようにクラス定義にデコレータを追加する必要があります。
# same imports as earlier.
from vtkmodules.vtkCommonDataModel import vtkDataSet
from vtkmodules.util.vtkAlgorithm import VTKPythonAlgorithmBase
from vtkmodules.numpy_interface import dataset_adapter as dsa

# new module for ParaView-specific decorators.
from paraview.util.vtkAlgorithm import smproxy, smproperty, smdomain

@smproxy.filter(label="Half-V Filter")
@smproperty.input(name="Input")
class HalfVFilter(VTKPythonAlgorithmBase):
    # the rest of the code here is unchanged.
    def __init__(self):
        VTKPythonAlgorithmBase.__init__(self)

    def RequestData(self, request, inInfo, outInfo):
        # get the first input.
        input0 = dsa.WrapDataObject(vtkDataSet.GetData(inInfo[0]))

        # compute a value.
        data = input0.PointData["V"] / 2.0

        # add to output
        output = dsa.WrapDataObject(vtkDataSet.GetData(outInfo))
        output.PointData.append(data, "V_half");
        return 1
この新しいフィルタを使用するには、これを *.py ファイルに保存し、Tools > Plugin Manager から Plugin Manager を使用してプラグインとしてロードします。成功すると、 Filters メニューに Half-V Filter が表示されます。
デコレータを使用すると、クラスをフィルタまたはソースとして公開するだけでなく、クラスのメソッドを呼び出してパラメータを設定するUIウィジェットを追加できます。
次の例では、UIを使用してさまざまなパラメータを制御する PythonベースのSuperquadric Source Example という名前の新しいソースを追加します。
# to add a source, instead of a filter, use the `smproxy.source` decorator.
@smproxy.source(label="Python-based Superquadric Source Example")
class PythonSuperquadricSource(VTKPythonAlgorithmBase):
    """This is dummy VTKPythonAlgorithmBase subclass that
    simply puts out a Superquadric poly data using a vtkSuperquadricSource
    internally"""
    def __init__(self):
        VTKPythonAlgorithmBase.__init__(self,
                nInputPorts=0,
                nOutputPorts=1,
                outputType='vtkPolyData')
        from vtkmodules.vtkFiltersSources import vtkSuperquadricSource
        self._realAlgorithm = vtkSuperquadricSource()

    def RequestData(self, request, inInfo, outInfo):
        from vtkmodules.vtkCommonDataModel import vtkPolyData
        self._realAlgorithm.Update()
        output = vtkPolyData.GetData(outInfo, 0)
        output.ShallowCopy(self._realAlgorithm.GetOutput())
        return 1

    # for anything too complex or not yet supported, you can explicitly
    # provide the XML for the method.
    @smproperty.xml("""
        <DoubleVectorProperty name="Center"
            number_of_elements="3"
            default_values="0 0 0"
            command="SetCenter">
            <DoubleRangeDomain name="range" />
            <Documentation>Set center of the superquadric</Documentation>
        </DoubleVectorProperty>""")
    def SetCenter(self, x, y, z):
        self._realAlgorithm.SetCenter(x,y,z)
        self.Modified()

    # In most cases, one can simply use available decorators.
    @smproperty.doublevector(name="Scale", default_values=[1, 1, 1])
    @smdomain.doublerange()
    def SetScale(self, x, y, z):
        self._realAlgorithm.SetScale(x,y,z)
        self.Modified()

    @smproperty.intvector(name="ThetaResolution", default_values=16)
    def SetThetaResolution(self, x):
        self._realAlgorithm.SetThetaResolution(x)
        self.Modified()

    @smproperty.intvector(name="PhiResolution", default_values=16)
    @smdomain.intrange(min=0, max=1000)
    def SetPhiResolution(self, x):
        self._realAlgorithm.SetPhiResolution(x)
        self.Modified()

    @smproperty.doublevector(name="Thickness", default_values=0.3333)
    @smdomain.doublerange(min=1e-24, max=1.0)
    def SetThickness(self, x):
        self._realAlgorithm.SetThickness(x)
        self.Modified()
このスクリプトをプラグインとしてロードし、Python-based Superquadric Source Example ソースを作成すると、図 4.22 に示すように、Properties パネルが作成されます。
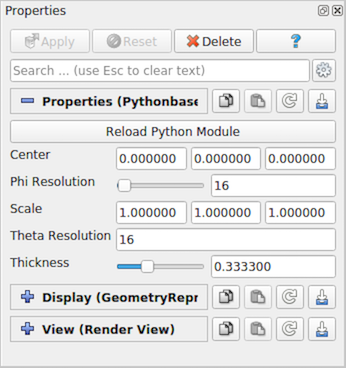
図 4.22 修飾されたPythonクラス PythonSuperquadricSource から自動的に生成される Properties パネル。
デコレーターは、新しい読者やライターを追加することも可能にします。NumPyを使用してテーブルを圧縮バイナリ配列として書き込むライターの例を次に示します。
# `smproxy.writer` decorator register the module as writer for the provided file
# extension.
@smproxy.writer(extensions="npz", file_description="NumPy Compressed Arrays", support_reload=False)
@smproperty.input(name="Input", port_index=0)
# this domain lets ParaView know which types of data this writer can write.
@smdomain.datatype(dataTypes=["vtkTable"], composite_data_supported=False)
class NumpyWriter(VTKPythonAlgorithmBase):
    def __init__(self):
        VTKPythonAlgorithmBase.__init__(self, nInputPorts=1, nOutputPorts=0, inputType='vtkTable')
        self._filename = None

    @smproperty.stringvector(name="FileName", panel_visibility="never")
    @smdomain.filelist()
    def SetFileName(self, fname):
        """Specify filename for the file to write."""
        if self._filename != fname:
            self._filename = fname
            self.Modified()

    def RequestData(self, request, inInfoVec, outInfoVec):
        from vtkmodules.vtkCommonDataModel import vtkTable
        from vtkmodules.numpy_interface import dataset_adapter as dsa

        table = dsa.WrapDataObject(vtkTable.GetData(inInfoVec[0], 0))
        kwargs = {}
        for aname in table.RowData.keys():
            kwargs[aname] = table.RowData[aname]

        import numpy
        numpy.savez_compressed(self._filename, **kwargs)
        return 1

    def Write(self):
        self.Modified()
        self.Update()