1. はじめに
ParaView is an open-source application for visualizing two- and three-dimensional datasets. The size of the datasets ParaView can handle varies widely depending on the architecture on which the application is run. The platforms supported by ParaView range from single-processor laptops or workstations to multiple-processor distributed-memory supercomputers or clusters. Using a parallel machine, ParaView can process very large data sets in parallel and display the results. To date, ParaView has been used to process datasets with billions of unstructured cells and over a trillion structured cells. ParaView’s parallel framework has run on over 100,000 processing cores.
ParaView’s design contains many conceptual features that make it stand apart from other scientific visualization solutions.
オープンソース、スケーラブル、マルチプラットフォームな可視化アプリケーション。
大規模なデータセットを処理するための分散計算モデルをサポートします。
オープンで柔軟、かつ直感的なユーザーインターフェース。
オープンスタンダードに基づく、拡張可能なモジュール式アーキテクチャ。
柔軟なBSD3条項ライセンス。
商業用保守・サポート。


ParaView is used by many academic, government, and commercial institutions all over the world. ParaView’s open license makes it impossible to track exactly how many users ParaView has, but it is very likely many thousands based on indirect evidence. For example, ParaView is downloaded roughly 100,000 times every year. ParaView won the HPCwire Readers’ Choice Award in 2010 and 2012 and HPCwire Editors’ Choice Award in 2010 for Best HPC Visualization Product or Technology.
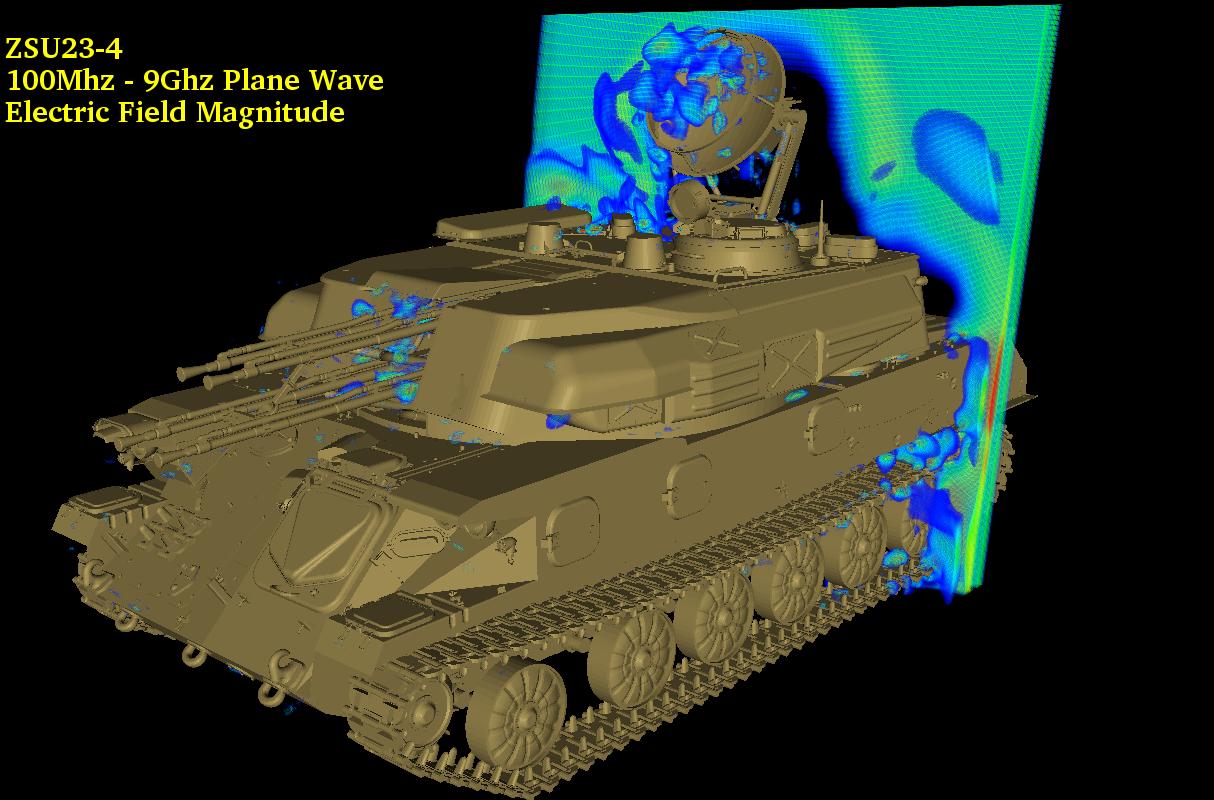
図 1.10 ZSU23-4ロシアの対空車両に平面波が直撃している様子。画像提供:Jerry Clarke, US Army Research Laboratory。
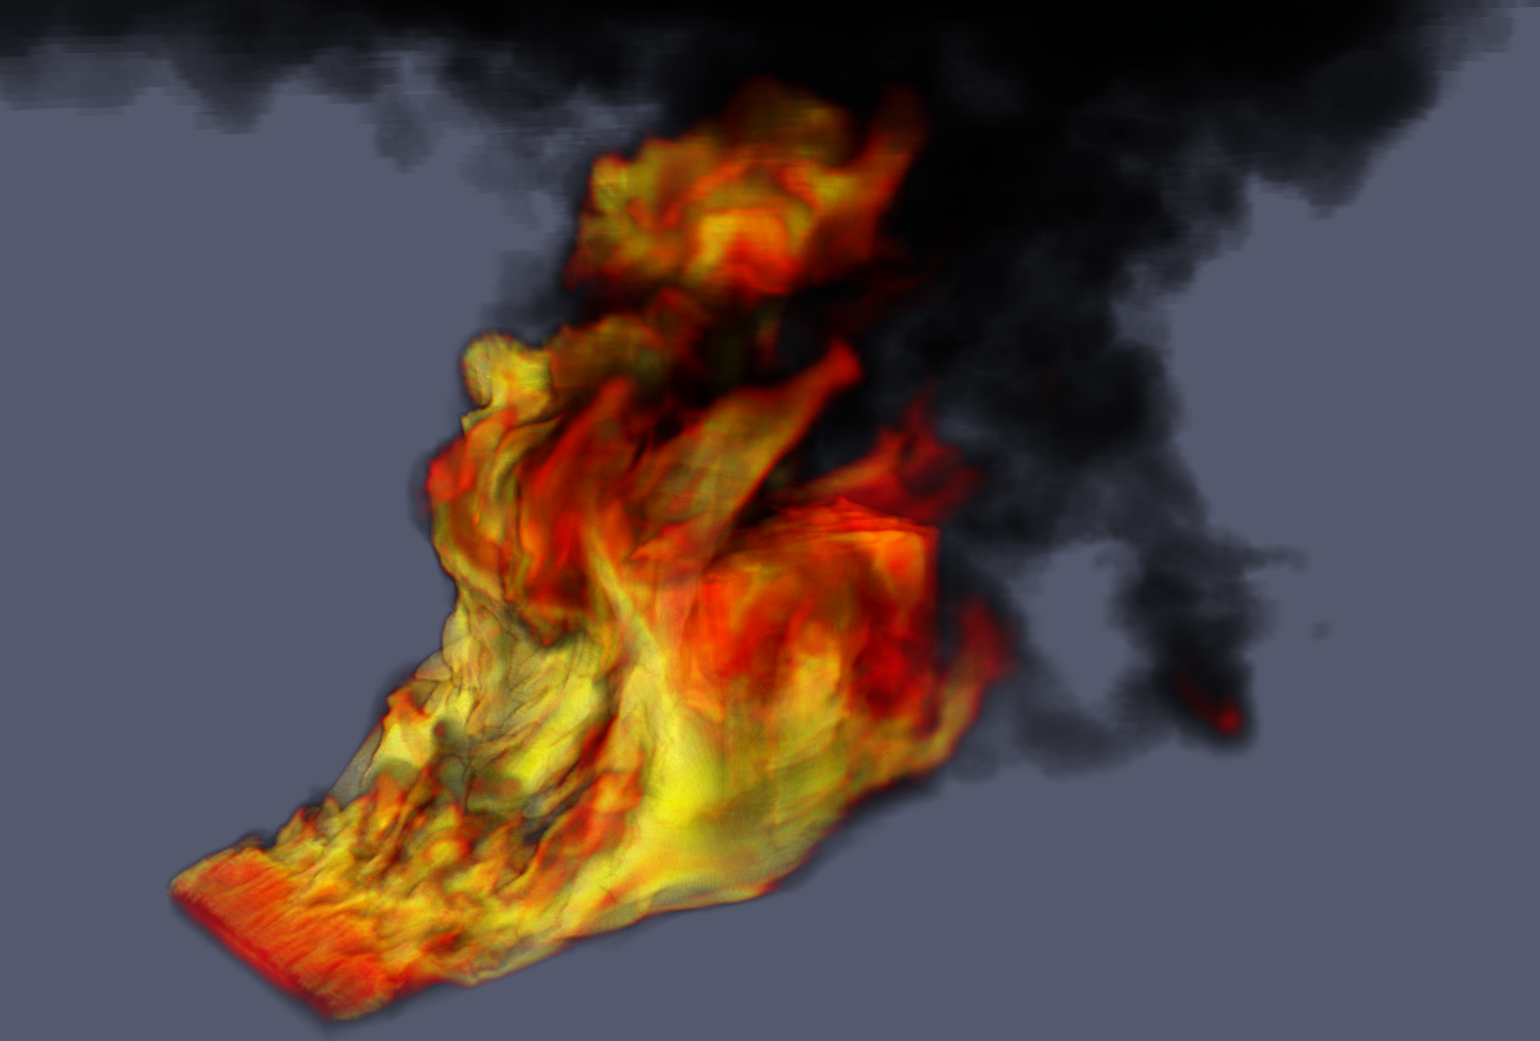
図 1.11 1000万個の非構造六面体セルによるSIERRA-Fuego-Syrinx-Caloreの疎結合シミュレーションによる横風による物体火災の再現。
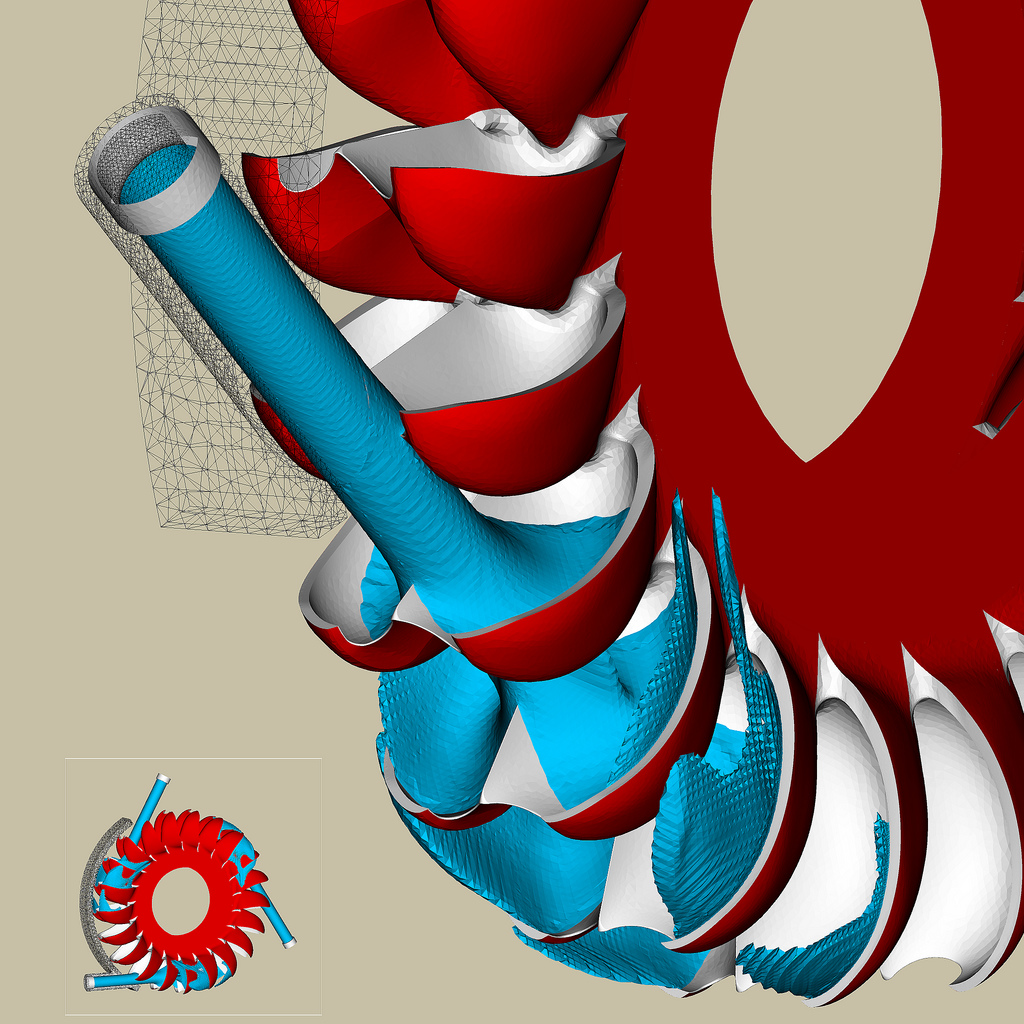
図 1.12 ペルトン型タービンのシミュレーション。画像提供:スイス国立スーパーコンピューティングセンター
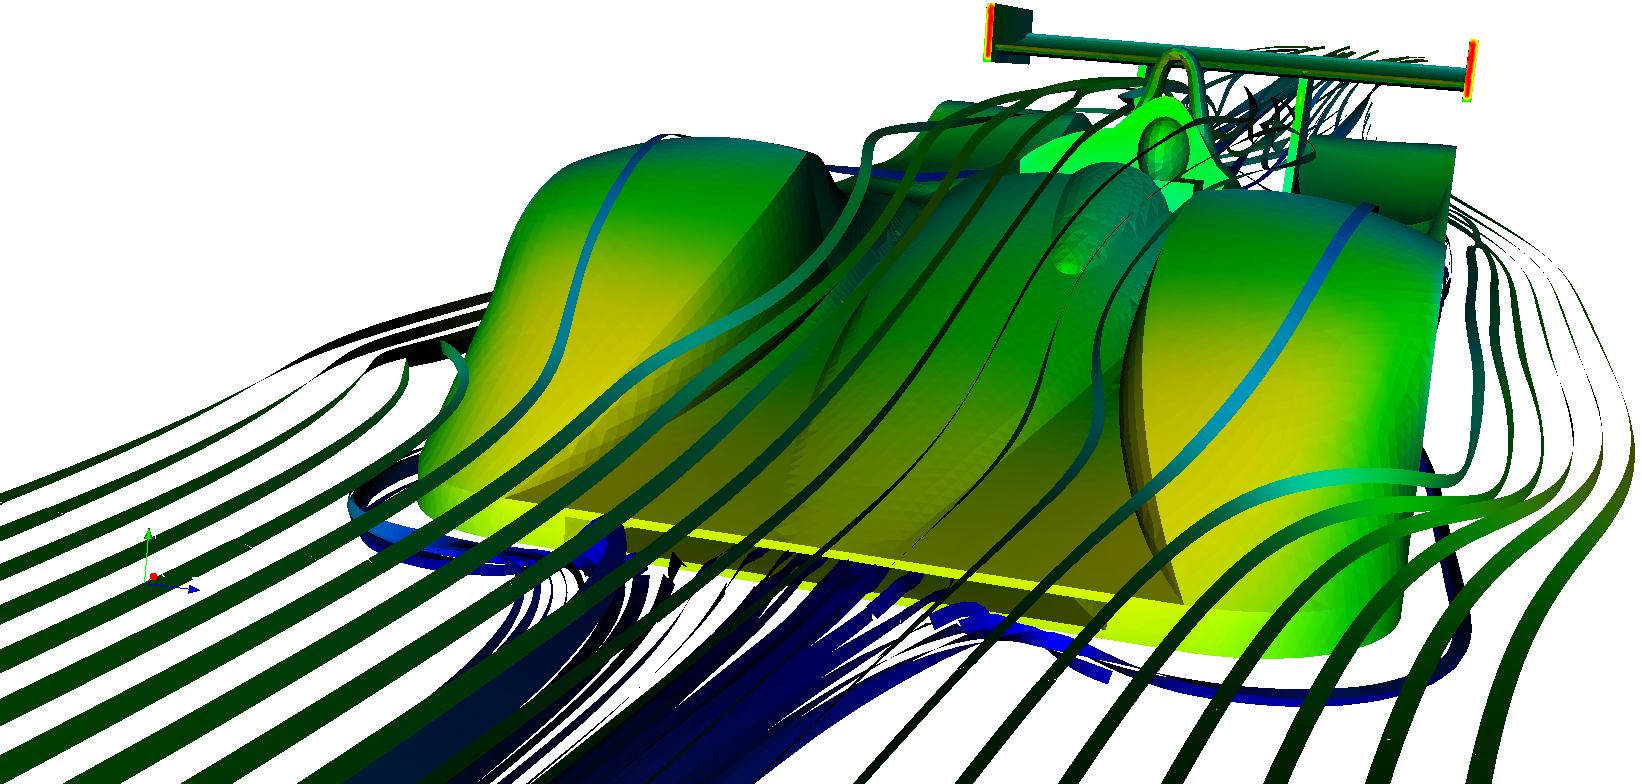
図 1.13 ル・マン・レースカー周辺の気流。画像提供:Renato N. Elias, NACAD/COPPE/UFRJ, Rio de Janerio, Brazil.
As demonstrated in these visualizations, ParaView is a general-purpose tool with a wide breadth of applications. In addition to scaling from small to large data, ParaView provides many general-purpose visualization tools as well as some algorithms specific to particular scientific disciplines. Finally, the ParaView system can be extended with custom visualization algorithms.
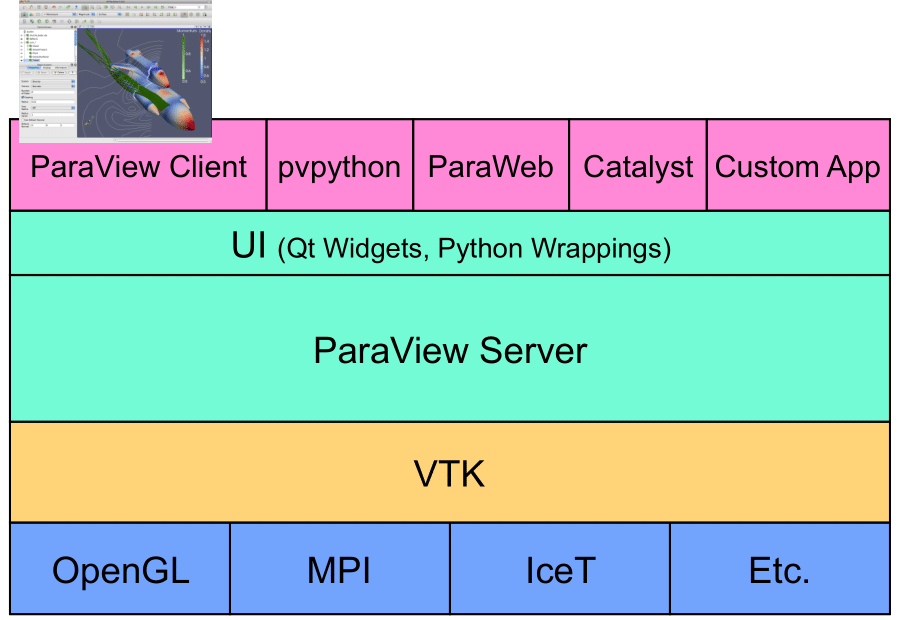
The application most people associate with ParaView is really just a small client application built on top of a tall stack of libraries that provide ParaView with its functionality. Because the vast majority of ParaView features are implemented in libraries, it is possible to completely replace the ParaView GUI with your own custom application. The ParaView application suite also allows users to automate visualization and post-processing with Python scripting.
ParaView includes a library of user interface components, maximizing code sharing. Another library provides the abstraction layer necessary for running parallel, interactive visualization. This relieves the client application from most of the details and complications when ParaView is running in parallel. The Visualization Toolkit (VTK) provides the basic visualization and rendering algorithms used by ParaView. VTK also provides basic functionalities such as rendering, parallel processing, file I/O, and parallel rendering. Although this tutorial demonstrates using ParaView through the ParaView client application, be aware that the modular design of ParaView allows for a great deal of flexibility and customization.
1.1. 開発・資金調達
ParaView プロジェクトは、2000年にKitware Inc.とLos Alamos National Laboratoryの共同作業として始まりました。最初の資金は、米国エネルギー省の ASCI Views プログラムとの 3年間の契約によって提供されました。最初の一般向けリリースである ParaView 0.6 は、2002年10月に発表されました。ParaView の開発は、Sandia National Laboratories、Los Alamos National Laboratories、Army Research Laboratory、その他様々な学術機関や政府機関とのKitware Inc.の協力により継続されています。
2005年9月、Kitware社、Sandia国立研究所、CSimSoft社は、ParaView 3.0の開発を開始しました。これは、ユーザーインターフェースをより使いやすいものに書き換えることと、定量分析のフレームワークを開発することに焦点を当てた大きな取り組みでした。ParaView 3.0は2007年5月にリリースされました。
この時から、ParaView の開発は続いています。2013年6月にリリースされた|ParaView| 4.0は、よりまとまりのあるGUIコントロールと、より優れたマルチブロックインタラクションを導入しています。その後のリリースでは、シミュレーションや他のアプリケーションにその場で統合するためのCatalystライブラリも含まれています。ParaView 5.0は2016年1月にリリースされ、レンダリングシステムのメジャーアップデートを提供しました。新しいレンダリングでは、OpenGL 3.2の機能を活用し、大幅な性能向上を実現しました。その後のリリースでは、OSPRayライブラリによるレイキャストレンダリングのサポートも追加されました。
ParaView の開発は今日も続いています。Sandia National LaboratoriesはASCプロジェクトを通じて、ParaView の開発に資金を提供し続けています。ParaView はSciDAC Scalable Data Management, Analysis, and Visualization (SDAV) Institute Toolkit https://sdav-scidac.org の一部です。米国エネルギー省もロスアラモス国立研究所と様々なSBIRプロジェクトや他の契約を通じて ParaView に資金を提供しています。米国国立科学財団も、SBIRプロジェクトを通じてしばしば ParaView に資金を提供しています。その他の機関も ParaView のサポート契約を結んでいます。フランス電力、ミラコ、石油業界の顧客などです。また、ParaViewはオープンソースのプロジェクトであるため、スイス国立スーパーコンピューティングセンターのような他の機関も独自の開発で貢献しています。
1.2. 可視化の基礎
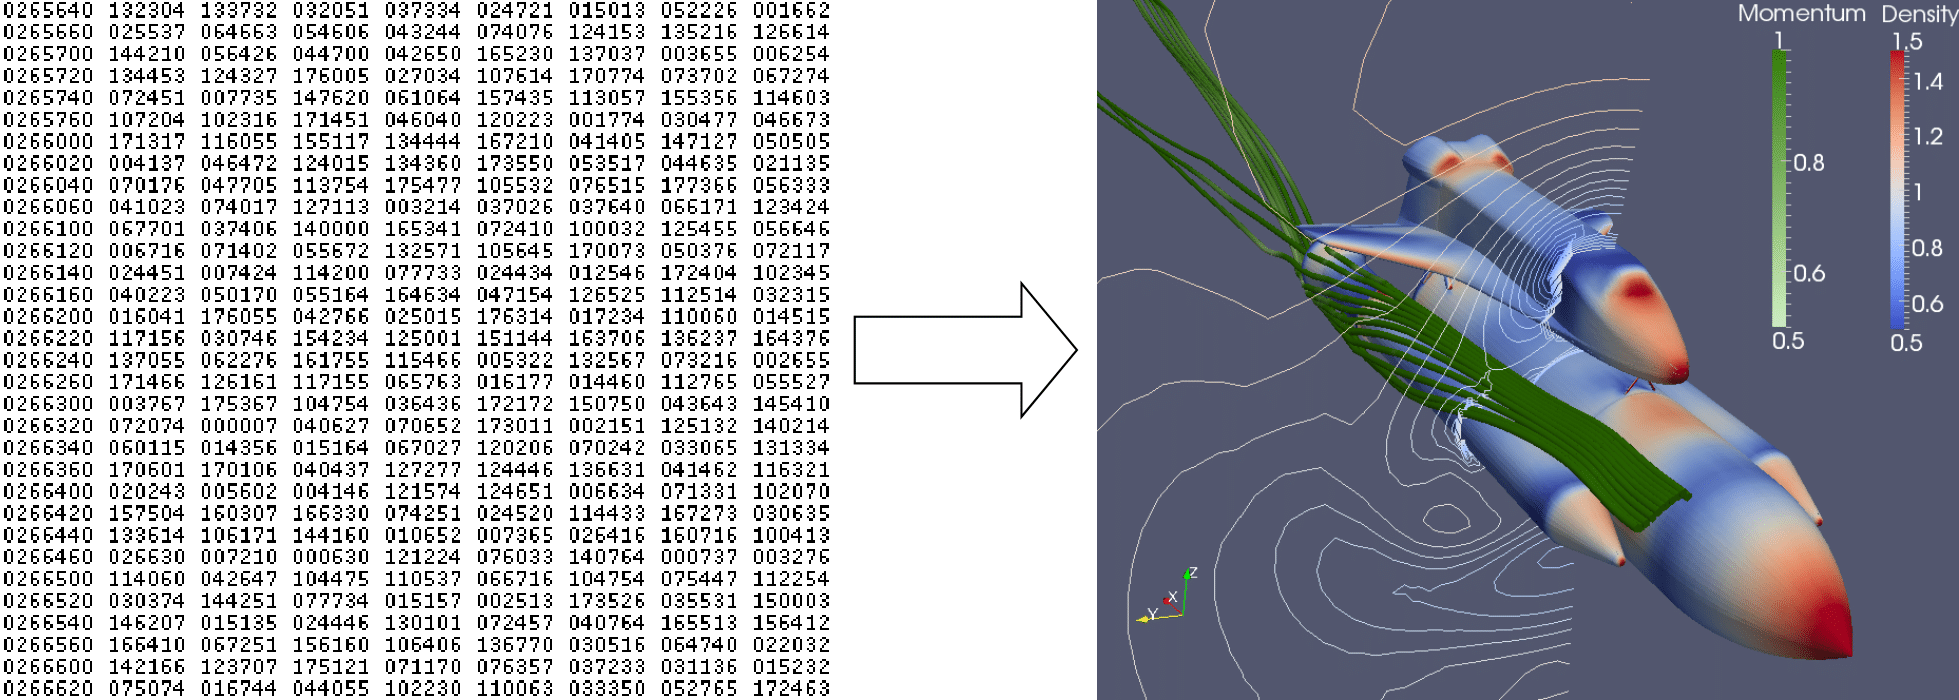
簡単に言うと、可視化のプロセスは、生のデータを、人間が見て理解できる形に変換することです。これにより、データをより認知的に理解することができるようになります。科学的可視化は、特に2Dまたは3D空間において明確に定義された表現を持つデータのタイプに関係しています。シミュレーションのメッシュやスキャナーのデータは、この種の分析に適しています。
データの可視化には、読み込み、フィルタリング、レンダリングという3つの基本ステップがあります。まず、データを ParaView に読み込まなければなりません。次に、データから特徴を生成、抽出、または導き出すために、データを処理する**フィルター** を任意の数を適用することができます。最後に、データから表示可能な画像がレンダリングされます。
ParaView was designed primarily to handle data with spatial representation. Thus the primary data types used in ParaView are generally meshes.
一様直線格子 (Image Data)
一様な直交格子とは、1次元、2次元、3次元のデータの配列のことである。各点は互いに直交し、各方向に規則正しく配置されています。
非一様直線格子 (Rectilinear Grid)
一様直線格子と似ているが、点間の間隔が各軸に沿って変化することがあります。
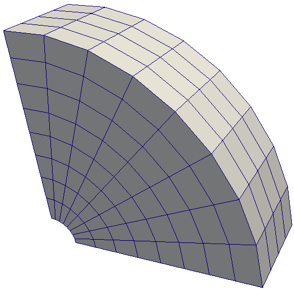
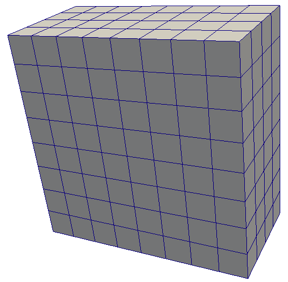
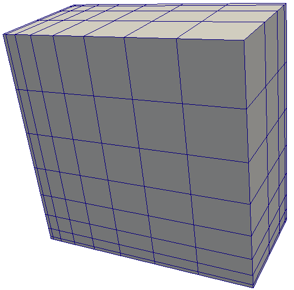
曲線格子 (Structured Grid)
曲線格子のトポロジーは非一様直線格子と同じである。しかし、曲線格子の各点は、任意の座標に配置することができます(ただし、セルが重なり合ったり、自己交差したりしないことが条件)。曲線格子は、非一様直線格子よりコンパクトなメモリフットプリントと暗黙のトポロジーを提供する一方で、メッシュの形状をより多様にすることができます。
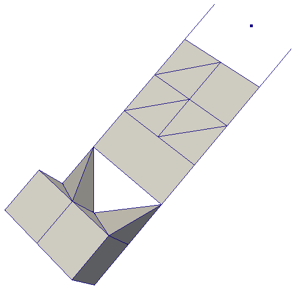
ポリゴン (Poly Data)
ポリゴンデータセットは、点、線、2次元ポリゴンで構成されます。セル間の接続は任意であり、存在しないこともあります。ポリゴンデータは基本的なレンダリングプリミティブを表しています。どのデータもレンダリング前にポリゴンデータに変換する必要があります(ボリュームレンダリングが採用されている場合を除く)が、ParaView はこの変換を自動的に行います。
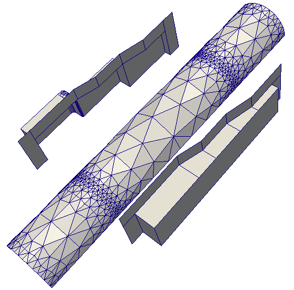
非構造格子
非構造データセットとは、点、線、2次元ポリゴン、3次元四面体、非線形セルから構成されるデータセットです。ポリゴンデータと似ていますが、直接レンダリングできない3次元四面体や非線形セルも表現できます。
これらの基本的なデータ型に加え、ParaView は multiblock データもサポートしています。基本的なマルチブロックデータセットは、データセットがグループ化されるときや、複数のブロックを含むファイルが読み込まれるときに作成されます。ParaView は、Hierarchical Adaptive Mesh Refinement (AMR) 、Hierarchical Uniform AMR、Octree、Tabular、および Graph タイプのデータセットを表現するための特別なデータ型もいくつか持っています。
1.3. その他の情報
There are many places to find more information about ParaView. ParaView documentation is found online at https://docs.paraview.org/en/latest/. The ParaView users guide is found at https://docs.paraview.org/en/latest/UsersGuide/index.html.
The ParaView web page, https://www.paraview.org/, is also an excellent place to find more information about ParaView. From there you can find helpful links to the ParaView Discourse forum, getting started help, training and tutorials and tools for developers. as well as information about professional support services.

ParaView’s help menu is also a good place to find useful information. It contains links to a getting started guide, the ParaView users guide, tutorials, example visualizations, community support (Discourse), release notes and much more.