4. データの理解
4.1. VTKデータモデル
To use ParaView effectively, you need to understand the ParaView data model. ParaView uses VTK, the Visualization Toolkit, to provide the visualization and data processing model. This chapter briefly introduces the VTK data model used by ParaView. For more details, refer to one of the VTK books [SML06] [KInc10].
VTKの最も基本的なデータ構造はデータオブジェクトです。データオブジェクトには、直線格子や有限要素メッシュ(下記参照)などの科学データセット、またはグラフやツリーなどのより抽象的なデータ構造があります。これらのデータセットは、メッシュ(トポロジとジオメトリ)と属性という小さな構成要素で構成されています。
4.1.1. メッシュ
メッシュをメモリに格納するために使用される実際のデータ構造はデータセットのタイプに依存しますが、いくつかの抽象化はすべてのタイプに共通しています。一般に、メッシュは頂点 (points) とセル (要素、ゾーン) で構成されます。セルは領域を離散化するために使用され、四面体、六面体などのさまざまなタイプを持つことができます。各セルには頂点のセットが含まれます。セルから頂点へのマッピングは接続性と呼ばれます。面や稜線などのデータ要素を定義することは可能ですが、VTKはこれらを明示的に表現していないことに注意してください。むしろ、それらはセルのタイプとその接続性によって暗示されます。この規則の1つの例外は、面を明示的に保存する任意の多面体です。 図 4.1 は、2つのセルで構成されるメッシュの例です。 最初のセルは頂点 \((0, 1, 3, 4)\) によって定義され、2番目のセルは頂点 \((1, 2, 4, 5)\) によって定義されます。これらのセルは、点 \((1, 4)\) によって定義されるエッジを共有するため、隣接しています。
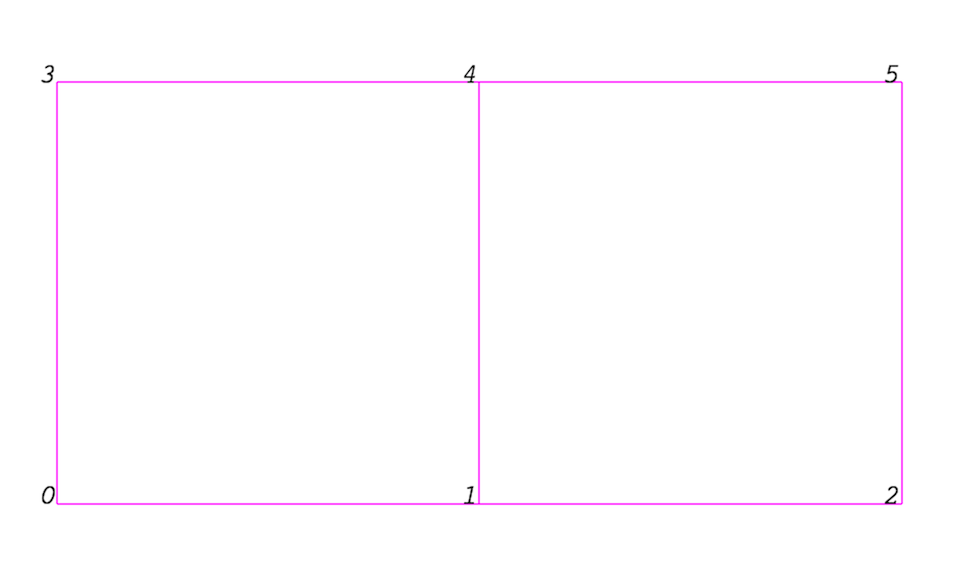
図 4.1 メッシュの例
メッシュは、そのトポロジと頂点の空間座標によって完全に定義されます。VTKでは、点座標は暗黙的である場合もあれば、\((点の個数 \times 3)\) 次元のデータ配列によって明示的に定義されている場合もあります。
4.1.2. 属性 (フィールド, 配列)
An attribute (or a data array or field) defines the discrete values of a field over the mesh. Examples of attributes include pressure, temperature, velocity, and stress tensor. Note that VTK does not specifically define different types of attributes. All attributes are stored as data arrays, which can have an arbitrary number of components. ParaView makes some assumptions in regards to the number of components. For example, a 3-component array is assumed to be an array of vectors. Attributes can be associated with points or cells. It is also possible to have attributes that are not associated with either. 図 4.2 demonstrates the use of a point-centered attribute. Note that the attribute is only defined on the vertices. Interpolation is used to obtain the values everywhere else. The interpolation functions used depend on the cell type. See the VTK documentation for details.
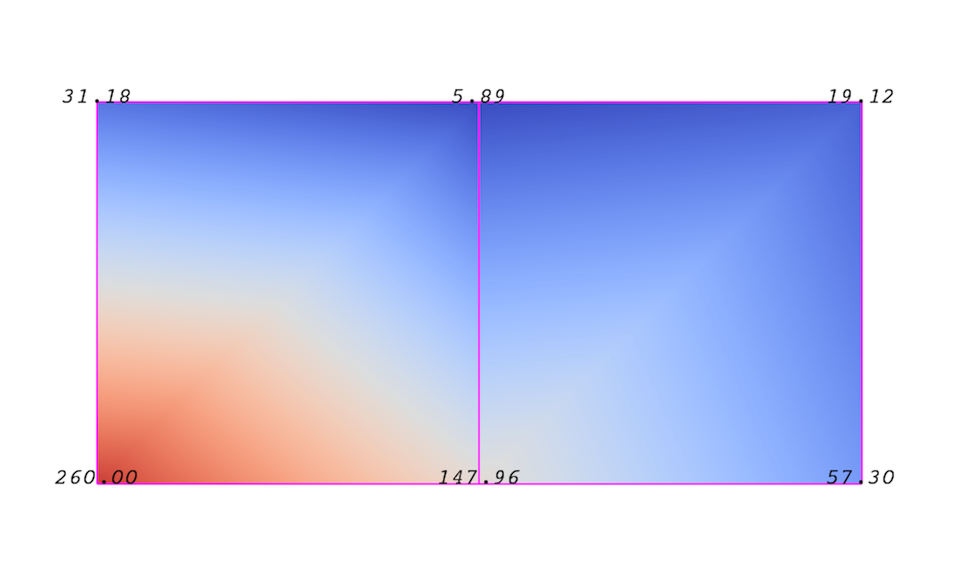
図 4.2 データ配列またはフィールドの点中心の属性
図 4.3 は、セル中心の属性の使用方法を示しています。セル中心の属性は、各セルで一定であるとみなされます。この特性のため、VTKの多くのフィルタは直接適用できません。 セルを中心とした属性に変換します。通常は、 Cell Data to Point Data フィルタを適用する必要があります。ParaView では、このフィルタは必要に応じて自動的に適用されます。
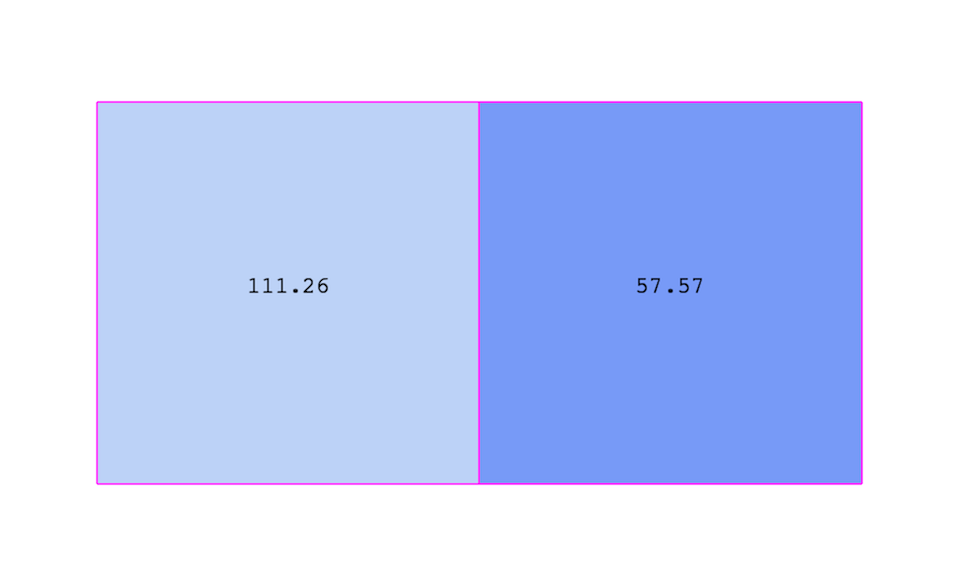
図 4.3 セル中心属性
4.1.3. 一様直線格子(イメージデータ)
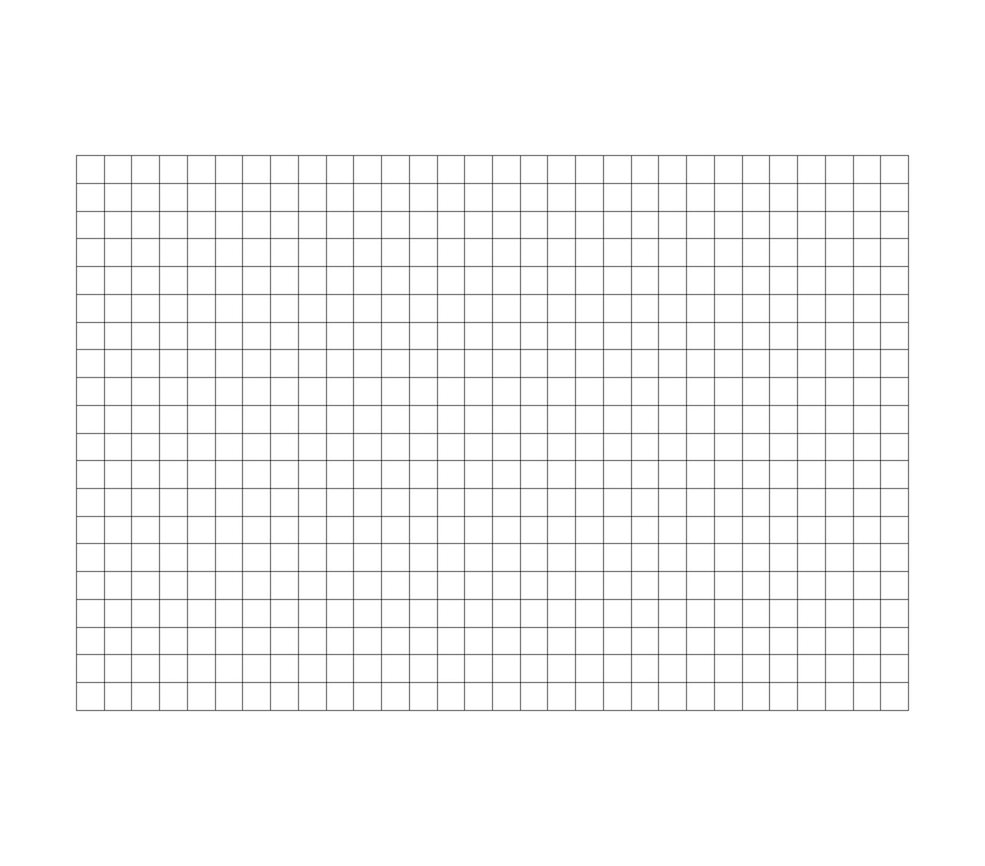
図 4.4 Example uniform rectilinear grid.
一様直線格子、すなわちイメージデータは、そのトポロジーおよび点座標を暗黙的に定義します (図 4.4)。イメージデータのメッシュを完全に定義するために、VTKは以下を使用します。
範囲 (Extents) - 各方向の最小および最大インデックスを定義します。例えば、範囲 \((0, 9)\) 、 \((0, 19)\) 、 \((0, 29)\) の画像データは、x方向に10点、y方向に20点、z方向に30点を有します。点の総数は \(10 \times 20 \times 30\) です。
原点 (Origin) - インデックス \((0, 0, 0)\) で定義された点の位置です。
間隔 (Spacing) - 各点間の距離です。各方向の間隔は個別に定義できます。
各点の座標は次のように定義されます。 \(coordinate=origin+index \times spacing\) ここで、 \(coordinate\)、 \(origin\)、 \(index\)、 \(spacing\) はベクトル長さ3です。
すべてのデータセットの汎用VTKインターフェースではフラットインデックスが使用されることに注意してください。 \((i,j,k)\) インデックスは、次のようにフラットインデックスに変換できます。: \(idx\_flat = k \times (npts_x \times npts_y) + j \times nptr_x + i\).
一様直線格子は、同じタイプのセルで構成されます。このタイプは、データセット(範囲に基づいて)の次元性によって決定され、頂点(0D)、線(1D)、ピクセル(2D)、またはボクセル(3D)のいずれかになります。
その規則的な性質により、画像データは他のデータセットよりも必要なストレージが少なくて済みます。 さらに、 VTK の多くのアルゴリズムは、このプロパティを利用するように最適化されており、画像データの効率が向上しています。
4.1.4. 非一様直線格子
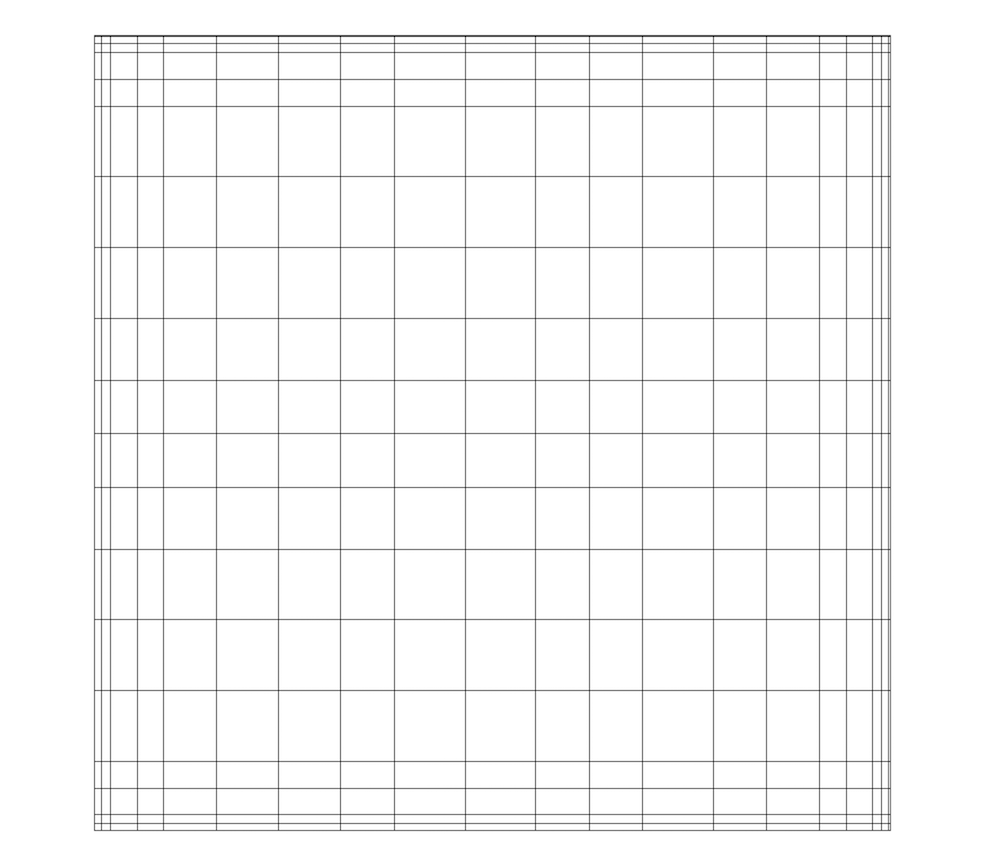
図 4.5 非一様直線格子
図 4.5 のような非一様直線格子は、そのトポロジーを暗黙的に定義し、点の座標を半暗黙的に定義します。直交格子のメッシュを完全に定義するために、VTKでは次のようにしています。
範囲 - 各方向の最小および最大インデックスを定義します。たとえば、範囲 \((0, 9)\)、 \((0, 19)\)、 \((0, 29)\) の直線格子は、x方向に10点、y方向に20点、z方向に30点を持ちます。点の総数は \(10 \times 20 \times 30\) です。
x、y、z方向の座標を定義する3つの配列 - これらの配列の長さは \(npts_x\)、 \(npts_y\)、および \(npts_z\) です。これらの配列で使用されるメモリーの合計は \(npts_x\times npts_y\times npts_z\) ではなく \(npts_x+npts_y+npts_z\) であるため、これはメモリーの大幅な節約になります。
各点の座標は次のように定義されます。:
\(coordinate = (coordinate\_array_x(i), coordinate\_array_y(j), coordinate\_array_z(k))\) .
すべてのデータセットの汎用VTKインターフェースではフラットインデックスが使用されることに注意してください。 \((i,j,k)\) インデックスは、次のようにフラットインデックスに変換できます。: \(idx\_flat = k \times (npts_x \times npts_y) + j \times nptr_x + i\).
直線格子は、同じ種類のセルで構成されます。このタイプは、データセット(範囲に基づいて)の次元性によって決定され、頂点(0D)、線(1D)、ピクセル(2D)、またはボクセル(3D)のいずれかになります。
4.1.5. 曲線格子 (構造格子)
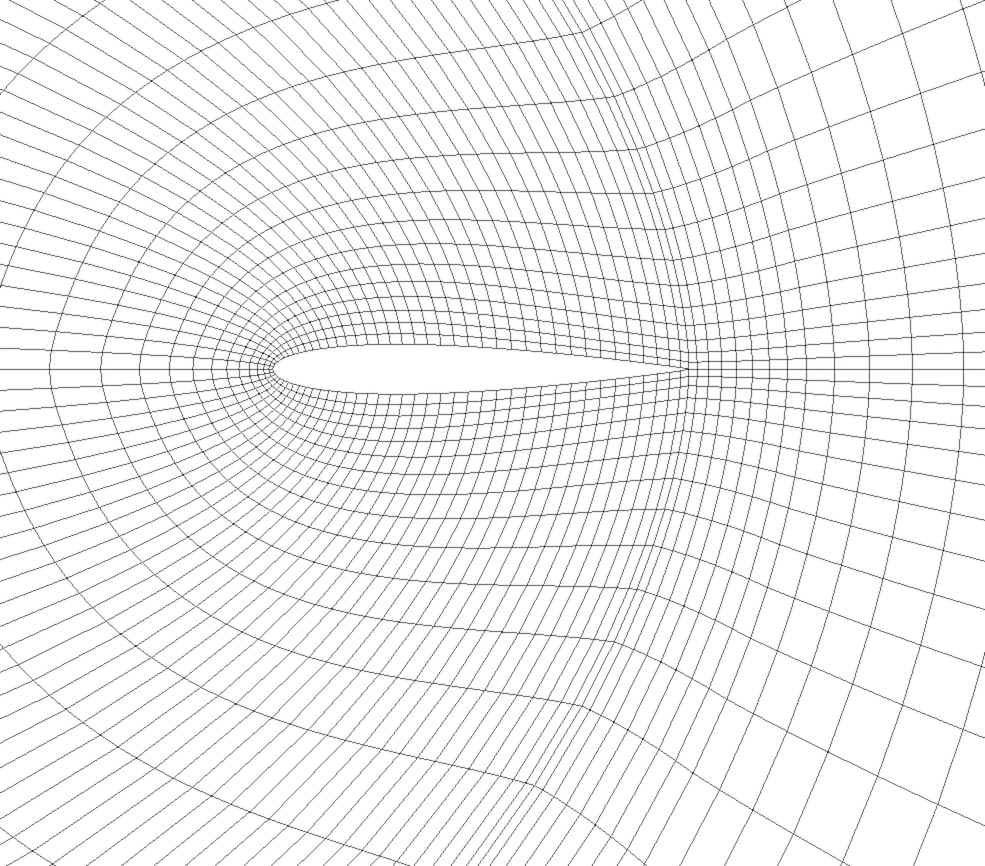
図 4.6 曲線格子または構造格子
図 4.6 のような曲線格子は、そのトポロジを暗黙的に定義し、点座標を明示的に定義します。曲線格子のメッシュを完全に定義するために、VTKは次のように使用します。:
範囲 - 各方向の最小および最大インデックスを定義します。たとえば、オブジェクト範囲 \((0, 9)\)、 \((0, 19)\)、 \((0, 29)\) の曲線格子は、曲線メッシュ上に \(10 \times 20 \times 30\) 個の点が規則的に定義されています。
点座標の配列 - この配列は、各頂点の位置を明示的に格納します。
各点の座標は次のように定義されます。: \(coordinate = coordinate\_array(idx\_flat)\). \((i,j,k)\) インデックスは、次のようにフラットインデックスに変換できます。: \(idx\_flat = k \times (npts_x \times npts_y) + j \times npts_x + i\).
曲線格子は、同じタイプのセルで構成されます。このタイプは、データセット(範囲に基づいて)の次元性によって決定され、頂点(0D)、直線(1D)、四角形(2D)、または六面体(3D)のいずれかになります。
4.1.6. AMR データセット
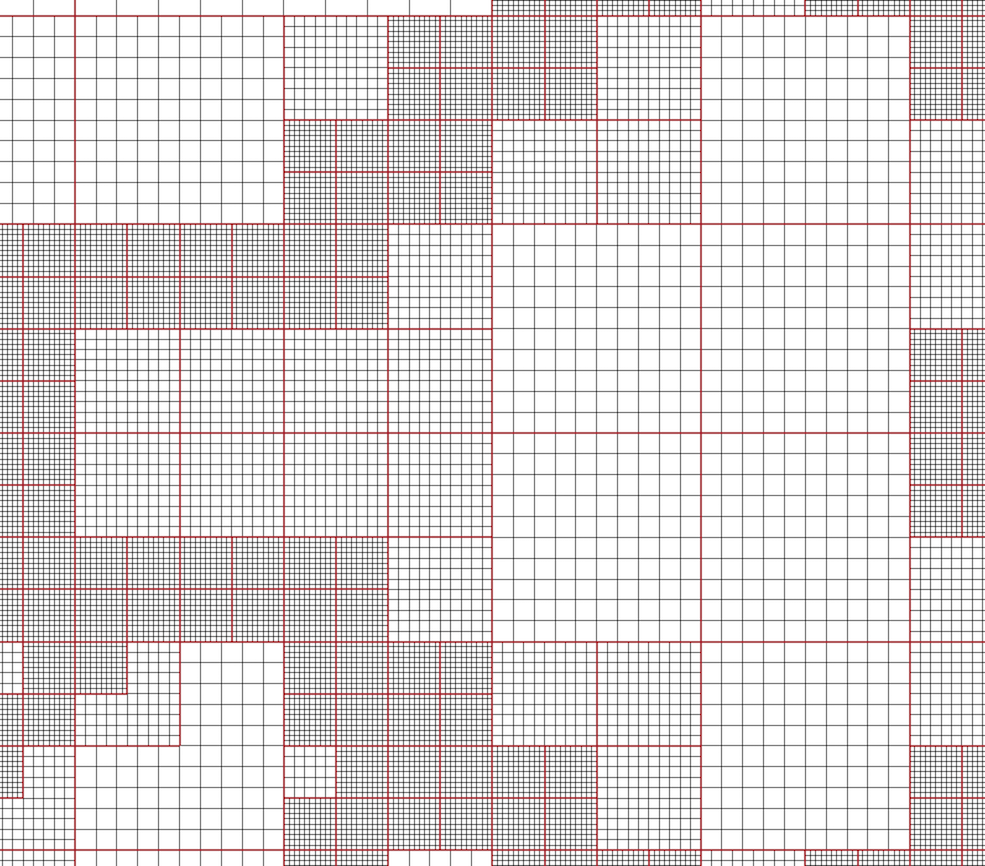
図 4.7 AMR データセット
VTKは、図 4.7 に示すように、Berger-Oligerタイプの AMR データセットをネイティブでサポートしています。 AMR データセットは、基本的に増加する細分率 (間隔の減少) の下でグループ化された、一様直線格子のコレクションです。VTKの AMR データセットでは、これらの格子が重なるかどうか、どのように重なり合うかについての制約はありません。ただし、バイトの配列を使用して、直線格子のサブ領域をマスキング(ブランキング)する機能をサポートします。 これにより、VTKは最小限のアーティファクトで重複する格子を処理することができます。VTKはBerger‐Oliger準拠メッシュのマスキング配列を自動的に生成できます。
4.1.7. 非構造格子
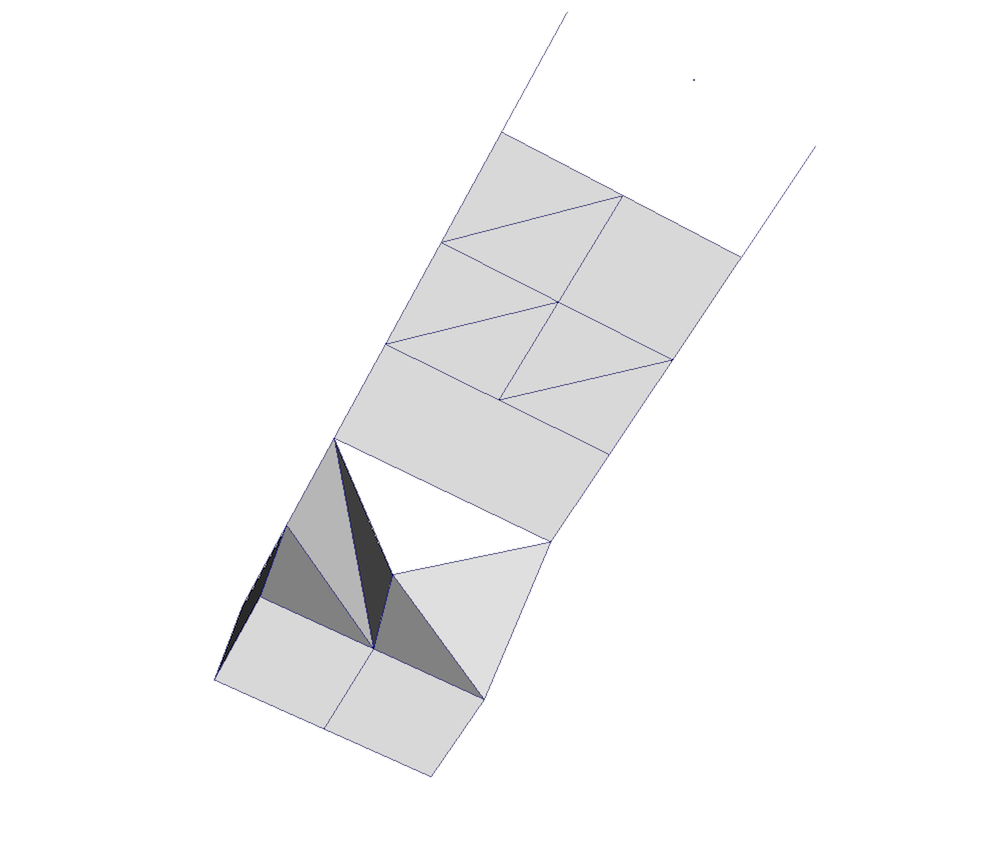
図 4.8 非構造格子
An unstructured grid, such as 図 4.8, is the most
general primitive dataset type. It stores topology and point coordinates
explicitly. Even though VTK uses a memory-efficient data structure to store the
topology, an unstructured grid uses significantly more memory to represent its
mesh. Therefore, use an unstructured grid only when you cannot represent your
dataset as one of the above datasets. VTK supports a large number of cell types,
all of which can exist within one heterogeneous unstructured grid. The full
list of all cell types supported by VTK can be found in the file vtkCellType.h
in the VTK source code. Here is the list of cell types as of when this document was written:
VTK_EMPTY_CELL |
VTK_BIQUADRATIC_TRIANGLE |
VTK_VERTEX |
VTK_CUBIC_LINE |
VTK_POLY_VERTEX |
VTK_CONVEX_POINT_SET |
VTK_LINE |
VTK_POLYHEDRON |
VTK_POLY_LINE |
VTK_PARAMETRIC_CURVE |
VTK_TRIANGLE |
VTK_PARAMETRIC_SURFACE |
VTK_TRIANGLE_STRIP |
VTK_PARAMETRIC_TRI_SURFACE |
VTK_POLYGON |
VTK_PARAMETRIC_QUAD_SURFACE |
VTK_PIXEL |
VTK_PARAMETRIC_TETRA_REGION |
VTK_QUAD |
VTK_PARAMETRIC_HEX_REGION |
VTK_TETRA |
VTK_HIGHER_ORDER_EDGE |
VTK_VOXEL |
VTK_HIGHER_ORDER_TRIANGLE |
VTK_HEXAHEDRON |
VTK_HIGHER_ORDER_QUAD |
VTK_WEDGE |
VTK_HIGHER_ORDER_POLYGON |
VTK_PYRAMID |
VTK_HIGHER_ORDER_TETRAHEDRON |
VTK_PENTAGONAL_PRISM |
VTK_HIGHER_ORDER_WEDGE |
VTK_HEXAGONAL_PRISM |
VTK_HIGHER_ORDER_PYRAMID |
VTK_QUADRATIC_EDGE |
VTK_HIGHER_ORDER_HEXAHEDRON |
VTK_QUADRATIC_TRIANGLE |
VTK_LAGRANGE_CURVE |
VTK_QUADRATIC_QUAD |
VTK_LAGRANGE_TRIANGLE |
VTK_QUADRATIC_POLYGON |
VTK_LAGRANGE_QUADRILATERAL |
VTK_QUADRATIC_TETRA |
VTK_LAGRANGE_TETRAHEDRON |
VTK_QUADRATIC_HEXAHEDRON |
VTK_LAGRANGE_HEXAHEDRON |
VTK_QUADRATIC_WEDGE |
VTK_LAGRANGE_WEDGE |
VTK_QUADRATIC_PYRAMID |
VTK_LAGRANGE_PYRAMID |
VTK_BIQUADRATIC_QUAD |
VTK_BEZIER_CURVE |
VTK_TRIQUADRATIC_HEXAHEDRON |
VTK_BEZIER_TRIANGLE |
VTK_TRIQUADRATIC_PYRAMID |
VTK_BEZIER_QUADRILATERAL |
VTK_QUADRATIC_LINEAR_QUAD |
VTK_BEZIER_TETRAHEDRON |
VTK_QUADRATIC_LINEAR_WEDGE |
VTK_BEZIER_HEXAHEDRON |
VTK_BIQUADRATIC_QUADRATIC_WEDGE |
VTK_BEZIER_WEDGE |
VTK_BIQUADRATIC_QUADRATIC_HEXAHEDRON |
VTK_BEZIER_PYRAMID |
これらのセルタイプの多くは単純です。詳細については、VTKのドキュメントを参照してください。
4.1.8. 多角形格子 (ポリデータ)
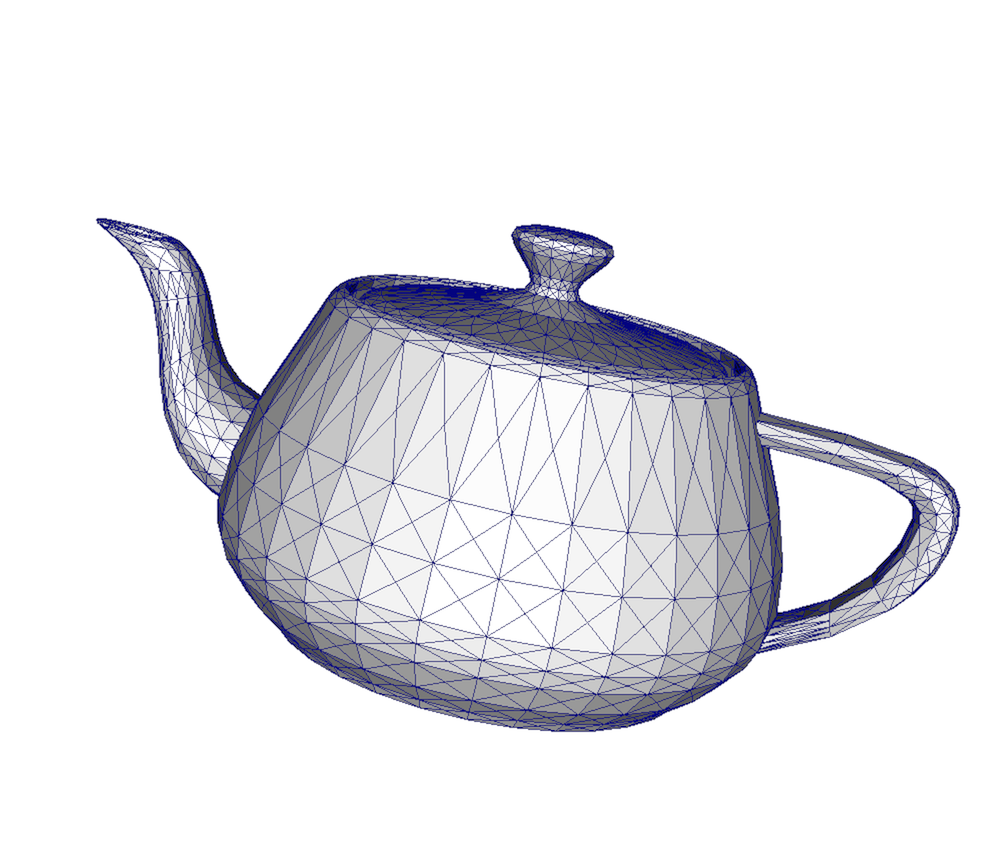
図 4.9 多角形格子
図 4.9 などのポリデータは、効率的なレンダリングのために設計された非構造格子の特殊バージョンです。0Dセル(頂点とポリ頂点)、1Dセル(線分とポリライン)、2Dセル(ポリゴンと三角形のストリップ)で構成されます。これらのセルタイプのみを生成する特定のフィルタは、ポリデータを生成します。たとえば、輪郭フィルタやスライスフィルタなどがあります。 非構造格子は、ポリデータでサポートされている2Dセルだけであれば、 Extract Surface Filter を使用してポリデータに変換できます。ポリデータは、 Clean to Grid を使用して非構造格子に変換できます。
4.1.9. 表 (Table)
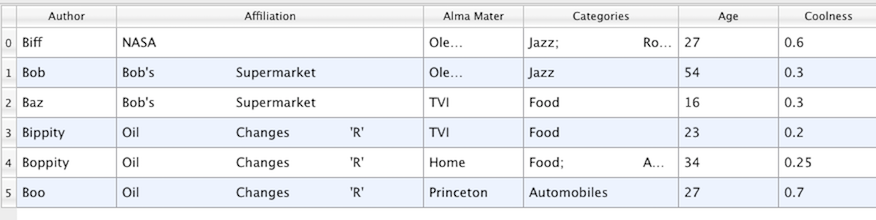
図 4.10 表 (Table)
図 4.10 などのテーブルは、行と列で構成される表形式のデータセットです。すべてのグラフビューは、テーブルを操作できるように設計されています。したがって、チャートビュー内に表示できるすべてのフィルタがテーブルを生成します。また、カンマ区切り値形式などのさまざまなファイル形式を使用して、テーブルを直接ロードすることもできます。テーブルは、適切な形式であれば、他のデータセットに変換できます。テーブルを変換するフィルタには、 Table to Points および Table to Structured Grid があります。
4.1.10. マルチブロックデータセット
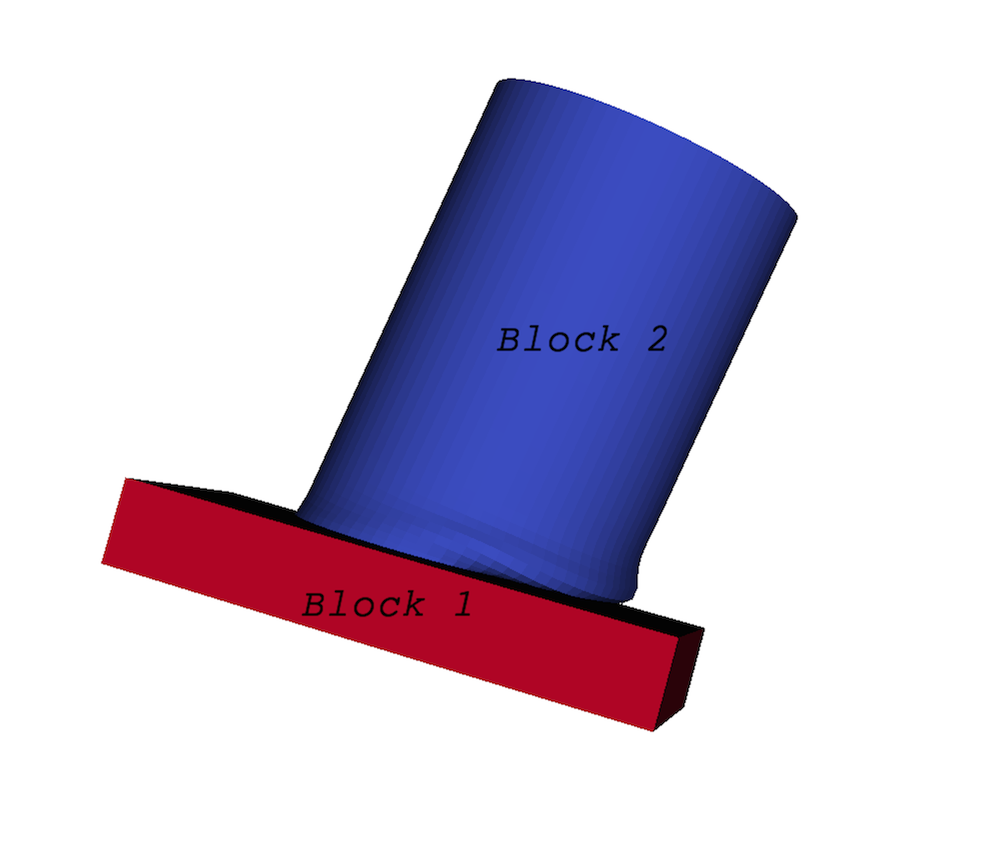
図 4.11 マルチブロックデータセット
You can think of a multiblock dataset (図 4.11) as a
tree of datasets where the leaf nodes are simple datasets. All of the
data types described above, except AMR, are simple datasets. Multiblock
datasets are used to group together datasets that are related. The relation
between these datasets is not necessarily defined by ParaView. A multiblock
dataset can represent an assembly of parts or a collection of meshes of
different types from a coupled simulation. Multiblock datasets can be loaded or
created within ParaView using the Group filter. Note that the leaf nodes of a
multiblock dataset do not all have to have the same attributes. We call attributes
that are not present on all blocks of a multiblock dataset partial attributes
or partial arrays If you apply a filter that requires an attribute, it will be
applied only to blocks that have that attribute.
4.1.11. マルチピースデータセット
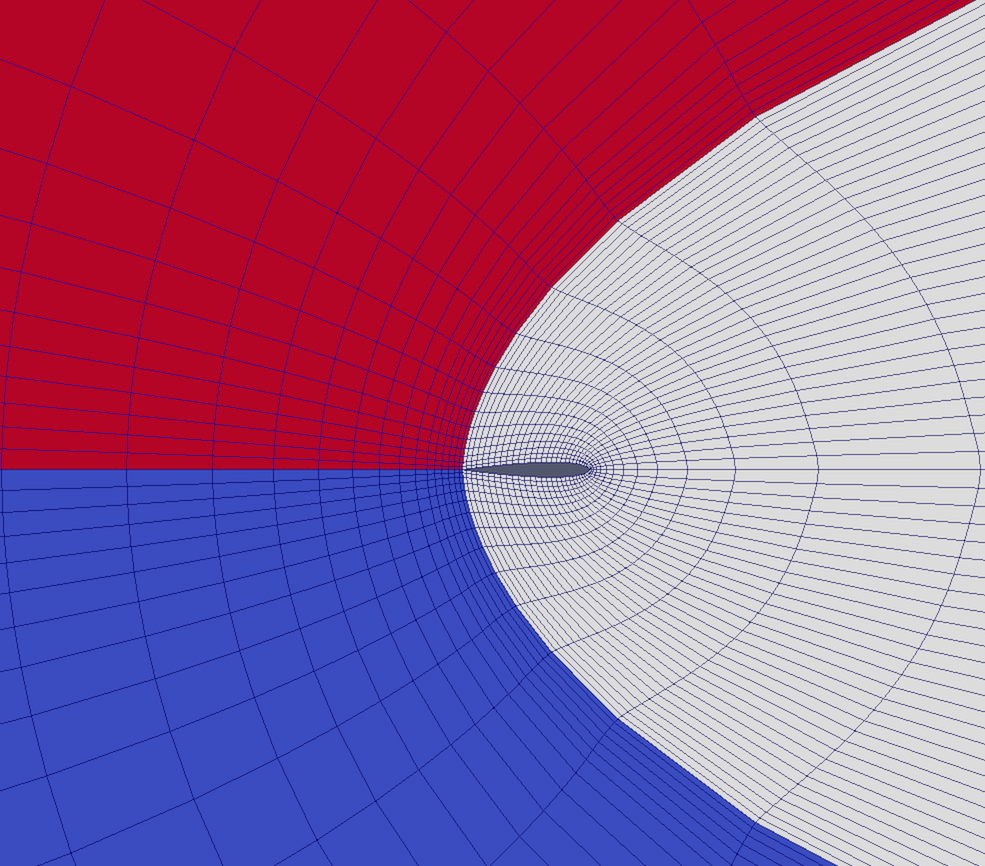
図 4.12 マルチピースデータセット
Multipiece datasets, such as 図 4.12, are similar to multiblock datasets in that they group together simple datasets. There is one key difference. Multipiece datasets group together datasets that are part of a whole mesh - datasets of the same type and with the same attributes. This data structure is used to collect datasets produced by a parallel simulation without having to append the meshes together. Note that there is no way to create a multipiece dataset within ParaView. It can only be created by using certain readers. Furthermore, multipiece datasets act, for the most part, as simple datasets. For example, it is not possible to extract individual pieces or to obtain information about them.
4.2. paraview でデータ情報を取得する
表示パイプライン(1.2 章)では、ソース、リーダー、およびフィルタがすべてデータを生成します。VTKベースのパイプラインでは、このデータはここで説明するタイプの1つです。したがって、ソースを作成するか、paraview でデータファイルを開いて Apply をクリックすると、データが生成されます。 Information パネルと Statistics Inspector パネルを使用すると、パイプラインモジュールによって生成されるデータの特性を検査できます。
4.2.1. Information パネル
Information パネルには、アクティブソースによって生成されたデータに関する概要情報が表示されます。デフォルトでは、このパネルは Properties パネルの下のタブの下にあります。表示/非表示を切り替えるには、View > Information を使用します。
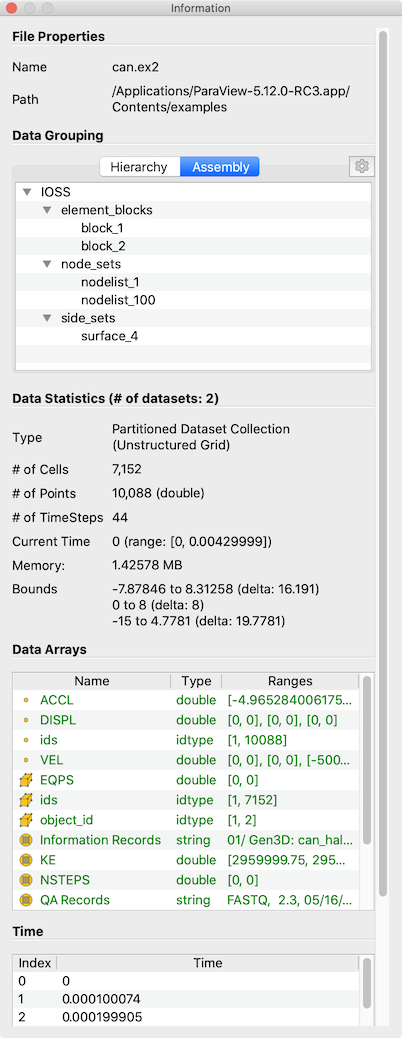
図 4.13 アクティブソースのデータ概要を表示する paraview の Information パネル
Information パネルには、アクティブソースのデータ情報が表示されます。したがって、 Properties パネルと同様に、アクティブソースが変更されると(例えば、 Pipeline Browser )変更されます。このパネルは、アクティブソースによって生成されたデータ currently (現在、カレント)の概要を示すパネルと考えることができます。新しく作成したパイプラインモジュールは、 Apply をクリックするまでデータを生成しません。したがって、新しく作成されたソースの有効な情報は、その Apply の後にのみこのパネルに表示されます。同様に、ソースのプロパティを変更して Apply をクリックすると、このパネルにデータ特性の変更が反映されます。さらに、時間パイプラインの場合、このパネルには現在のタイムステップのみの情報が表示されます(ただし、前述を除く)。したがって、時系列データセットの時間ステップをステップ実行すると、表示される情報が変更される可能性があり、パネルにはそれらの変更が反映されます。
Did you know?
Any text on this panel is copy-able. For example, if want to copy the
number of points value to use it as a property value on the Properties
panel, simply double-click on the number or click-and-drag to select the
number and use the common keyboard shortcut CTRL + C (or
⌘ + C) to copy that value to the clipboard. Now, you can paste it
in an input widget in paraview or any other application, such as an
editor, by using CTRL + V (or ⌘ + V) or the application-specific
shortcut for pasting text from the clipboard. The same is true for numbers shown in
lists, such as the Data Ranges .
The several groups of information comprise the panel itself. Groups may be hidden based on the type of pipeline module or the type of data being produced.
The file File Properties group is shown for readers with information about the
file that is opened. For a temporal file series, as you step through each
time step, the file name is updated to point to the name of the file in the
series that corresponds to the current time step.
The Data Grouping section shows information about composite datasets consisting of
more than one datasets in some kind of hierarchical arrangement. Two different hierarchies
are available. The Hierarchy shows the relationships of datasets inherent
in the composite dataset structure, while the Assembly shows relationships among
datasets that are explicitly defined by the data source.
The Data Statistics group provides a summary of the dataset produced including its
type, its number of cells and points (or rows and columns in cases of Tabular
datasets), the number of timesteps, the current time, and an estimate of the memory used by the
dataset. This number only includes the memory space needed to save the data arrays for the dataset.
It does not include the memory space used by the data structures themselves and, hence, must only
be treated as an estimate. Lastly, the group shows the spatial bounds of the datasets in 3D Cartesian
space. This will be unavailable for non-geometric datasets such as tables.
The Data Arrays group lists all of the available point, cells, and field arrays,
as well as their types and ranges for the current time step. The Current Time
field shows the time value for the current timestep as a reference. As with
other places in paraview, the icons  ,
,  , and
, and  are used
to indicate cell, point, and field data arrays. Since data arrays can have multiple
components, the range for each component of the data array is shown.
are used
to indicate cell, point, and field data arrays. Since data arrays can have multiple
components, the range for each component of the data array is shown.
リーダーモジュールの場合、Time グループには、ファイルで指定された使用可能な時間ステップと対応する時間値が表示されます。
一様直線格子や曲線格子などの構造データセットの場合、データセットの構造化範囲と寸法を表示する Extents グループが表示されます。
All of the summary information discussed so far provides a synopsis of the entire dataset
produced by the pipeline module, including across all ranks (which will become
clearer once we look at using ParaView for parallel data processing). In cases
of composite datasets, such as mutliblock datasets or AMR datasets, recall that
these are datasets that are made up of other datasets. In such cases, these
are summaries over all the blocks in the composite dataset. Every so often,
you will notice that the Data Arrays table lists an array with the suffix
(partial) (Figure 図 4.14).
Such arrays are referred to as partial arrays. Partial arrays
is a term used to refer to arrays that are present on some non-composite
blocks or leaf nodes in a composite dataset, but not all. The (partial)
suffix to indicate partial arrays is also used by paraview in other
places in the UI.
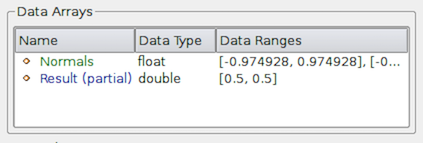
図 4.14 Information パネルの Data Arrays セクションに 部分 配列が表示されています。部分配列は、複合データセット内の特定のブロックに存在する配列ですが、すべてではありません。
複合データセット内のすべてのデータセットの集計は便利ですが、個々のブロックのデータ情報も参照する必要があります。 これを行うには、複合データセットを要約するときに表示される Data Hierarchy グループを使用します。 Data Hierarchy ウィジェットは、複合データセットの構造または階層を示します(図 4.15)。Information パネルが切り替わり、選択したサブツリーの概要が表示されます。 デフォルトでは、ルート要素が選択されます。階層内の任意のブロックを選択して、そのサブツリーに限定された概要を表示できるようになりました。

図 4.15 複合データ階層を示す Information パネルの Data Hierarchy セクション。このウィジェットで特定のブロックまたはサブツリーを選択すると、Information パネルがリセットされ、そのブロックまたはサブツリーの概要のみが表示されます。
Did you know?
Information パネルおよび Statistics Inspector に表示されるメモリ情報は、概算参照としてのみ使用し、特定のパイプラインモジュールによって生成されるデータに必要なメモリ量には変換しません。これは、次の要因によるものです。
このサイズには、データ配列を格納するためのデータ構造を構築するために必要なメモリ量は含まれません。ほとんどの場合、これはデータ配列の場合と比較すると無視できる程度ですが特に深くネストされた複合データセットを扱う場合は、これはそれほど重要ではありません。
CalculatorやShrinkなどのいくつかのフィルタでは、入力データ配列を渡すだけなので、入力と共有するデータ配列に余分なスペースは必要ありません。ただし、表示されているメモリサイズの数値は、これを考慮していません。
現在の状態で ParaView が使用している物理メモリの量の概要が必要な場合は、Memory Inspector を使用します(10 章)。
4.2.2. Statistics Inspector パネル
Information パネルには、アクティブソースのデータ情報が表示されます。すべてのパイプラインモジュールによって生成されるデータの概要が必要な場合は、Statistics Inspector パネルを使用できます。Views > Statistics Inspector からアクセスできます。
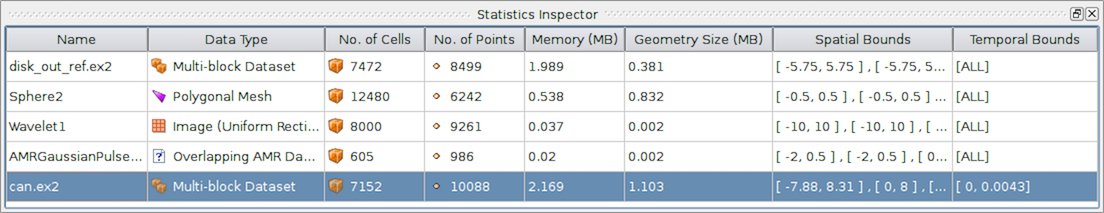
図 4.16 すべてのパイプラインモジュールの概要を表示する|paraview| の Statistics Inspector
このパネルのすべての情報は、Geometry Size を除き、Information パネルにも表示されます。これは、アクティブビューでのレンダリングに使用される変換されたデータセットに必要なメモリ量に対応します。たとえば、3Dデータセットを3Dビューのサーフェスとしてレンダリングするには、ParaView でサーフェスメッシュをポリデータとして抽出する必要があります。Geometry Size は、このポリデータに必要なメモリを、Information パネルと同じメモリサイズに関する注意書きで表します。
4.3. pvpython でデータ情報を取得する
ParaView でスクリプトを作成する場合、データに関する情報が必要になることがよくあります。paraview は、データの情報を使用してフィルタプロパティとカラーテーブルを自動的に設定しますが、スクリプト作成時に明示的に設定する必要があります。
pvpython では、任意のパイプラインモジュール(ソース、リーダーまたはフィルタ)に対して、次の方法で生成されたデータに関する情報を取得できます。
>>> from paraview.simple import *
>>> reader = OpenDataFile(".../ParaViewData/Data/can.ex2")

# We need to update the pipeline. Otherwise, all of the data
# information we get will be from before the file is actually
# read and, hence, will be empty.
>>> UpdatePipeline()

>>> dataInfo = reader.GetDataInformation()

# To get the number of cells or points in the dataset:
>>> dataInfo.GetNumberOfPoints()
10088
>>> dataInfo.GetNumberOfCells()
7152

# You can always nest the call, e.g.:
>>> reader.GetDataInformation().GetNumberOfPoints()
10088
>>> reader.GetDataInformation().GetNumberOfCells()
7152

# Use source.PointData or source.CellData to get information about
# point data arrays and cell data arrays, respectively.

# Let's print the available point data arrays.
>>> reader.PointData[:]
[Array: ACCL, Array: DISPL, Array: GlobalNodeId, Array: PedigreeNodeId, Array: VEL]

# Similarly, for cell data arrays:
>>> reader.CellData[:]
[Array: EQPS, Array: GlobalElementId, Array: ObjectId, Array: PedigreeElementId]
PointData (と CellData )は、キーが配列の名前で、値が各配列の詳細情報を提供するオブジェクトであるマップまたはディクショナリです。この節の残りの部分では、PointData で説明した内容は、 CellData にも適用できることを説明します。
# Let's get the number of available point arrays.
>>> len(reader.PointData)
5

# Print the names for all available point arrays.
>>> reader.PointData.keys()
['ACCL', 'DISPL', 'GlobalNodeId', 'PedigreeNodeId', 'VEL']

>>> reader.PointData.values()
[Array: ACCL, Array: DISPL, Array: GlobalNodeId, Array: PedigreeNodeId, Array: VEL]

# To test if a particular array is present:
>>> reader.PointData.has_key("ACCL")
True

>>> reader.PointData.has_key("--non-existent-array--")
False
PointData (または CellData )から、各配列の情報を提供するオブジェクトにアクセスできます。このオブジェクトは、データ範囲、コンポーネント数、タプル数などを取得するメソッドを提供します。
# Let's get information about 'ACCL' array.
>>> arrayInfo = reader.PointData["ACCL"]
>>> arrayInfo.GetName()
'ACCL'

# To get the number of components in each tuple and the number
# of tuples in the data array:
>>> arrayInfo.GetNumberOfTuples()
10088
>>> arrayInfo.GetNumberOfComponents()
3

# Alternative way for doing the same:
>>> reader.PointData["ACCL"].GetNumberOfTuples()
10088
>>> reader.PointData["ACCL"].GetNumberOfComponents()
3

# To get the range for a particular component, e.g. component 0:
>>> reader.PointData["ACCL"].GetRange(0)
(-4.965284006175352e-07, 3.212448973499704e-07)

# To get the range for the magnitude in cases of multi-component arrays
# use -1 as the component number.
>>> reader.PointData["ACCL"].GetRange(-1)
(0.0, 1.3329898584157294e-05)

# To determine the data data type for this array:
>>> from paraview import vtk
>>> reader.PointData["ACCL"].GetDataType() == vtk.VTK_DOUBLE
True
# The paraview.vtk module provides access to these constants such as
# VTK_DOUBLE, VTK_FLOAT, VTK_INT, etc.

# Likewise, to test the dataset type, itself:
>>> reader.GetDataInformation().GetDataSetType() == \
                               vtk.VTK_MULTIBLOCK_DATA_SET
True
次に、すべての点データ配列を反復処理し、その大きさの範囲を出力するサンプルスクリプトを示します。
>>> def print_point_data_ranges(source):
...    """Prints array ranges for all point arrays"""
...    for arrayInfo in source.PointData:
...        # get the array's name
...        name = arrayInfo.GetName()
...        # get magnitude range
...        range = arrayInfo.GetRange(-1)
...        print "%s = [%.3f, %.3f]" % (name, range[0], range[1])

# Let's call this function on our reader.
>>> print_point_data_ranges(reader)
ACCL = [0.000, 0.000]
DISPL = [0.000, 0.000]
GlobalNodeId = [1.000, 10088.000]
PedigreeNodeId = [1.000, 10088.000]
VEL = [0.000, 5000.000]
Did you know?
この節のサンプルスクリプトはすべて、点とセルの数、データ範囲、配列範囲などのデータに関する情報を取得する方法を示しています。ただし、rawデータ自体へのアクセス方法は表示されません。完全なデータを取得する方法については、8.13 章 を参照してください。